The Pennant Pattern: Meaning, Rules, and Applications

Pennants are compact continuation patterns that often form during strong trends. They look similar to some technical analysis setups but provide different signals. This article explores what pennants are, how to identify them, how they differ from similar patterns, and what to look for when trading them.
What Are Pennant Chart Patterns?
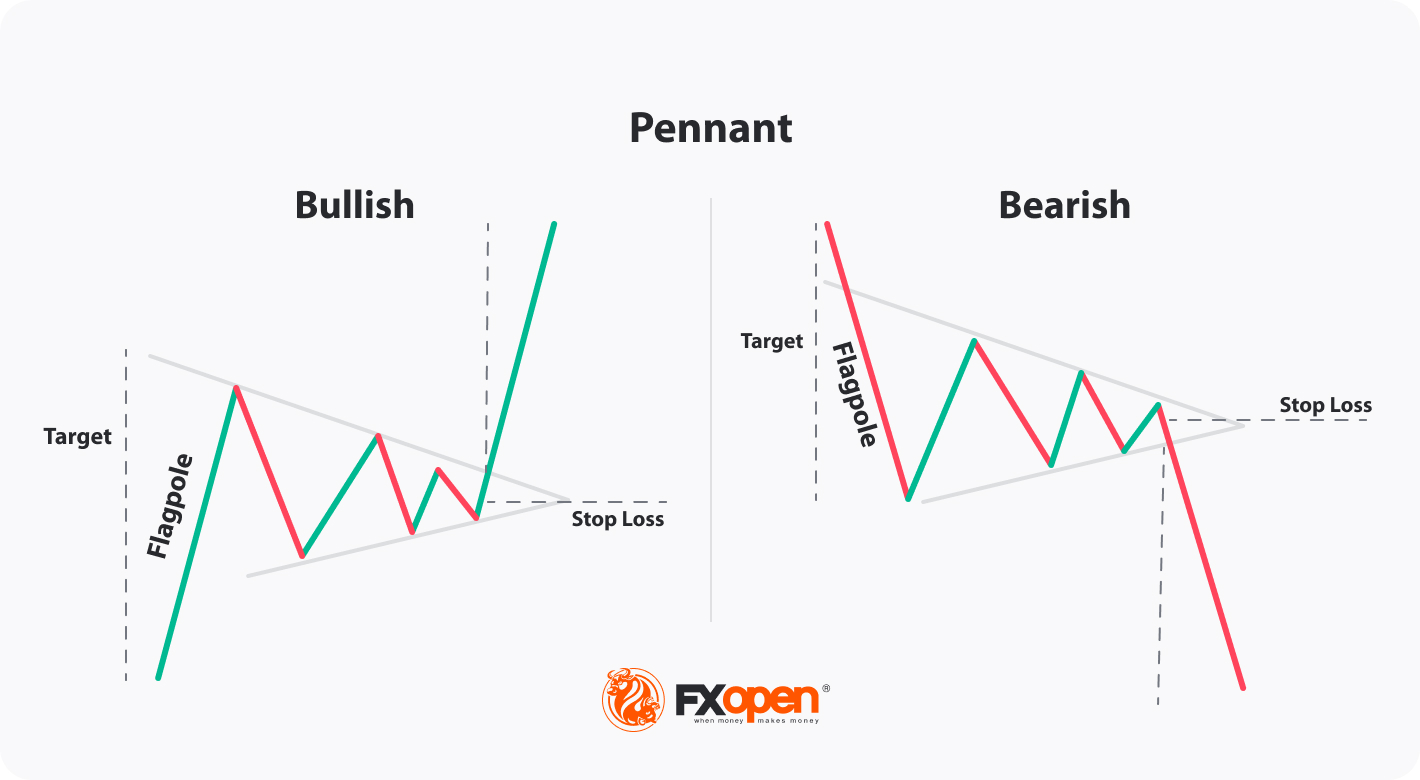
A pennant is a continuation chart pattern that forms during a brief pause in the trend. It is typically seen as a smaller version of a symmetrical triangle and has features of flags with a flagpole being commonly used to determine take-profit targets.
This formation can be either bullish or bearish, depending on the direction of the overall trend. A bullish pennant pattern occurs in an uptrend and signals a continuation of the price rise, while a bearish pennant pattern appears in a downtrend and signals a continuation of the price fall.
The pennant definition includes three parts: the flagpole (the sharp trending move that comes first), the consolidation zone (where the price moves sideways and forms converging trendlines), and the breakout (where the price moves out of the pattern, usually with strong volume).
Pennants can be found on many timeframes, from minute to weekly charts, and they are one of the most common chart patterns used in stock, cryptocurrency*, commodity, and forex trading.
Flags and Pennants: Differences
Flags and pennants both signal a trend continuation. The main difference between them is their structure. While flags consist of two parallel lines, forming a channel, pennants include two converging trendlines, forming a small symmetrical triangle.
The flag and pennant patterns also show slightly different events. Flags tend to indicate a clearer correcting move, where the price retraces slightly before continuing to move in the same direction. Pennants are tighter and often form when momentum stays strong. They may not pull back as much, instead just pausing and compressing.
Symmetrical Triangles and Pennants: Differences
Pennants and symmetrical triangles look similar. Both include two converging trendlines, which form a triangle shape. However, they still have differences.
A symmetrical triangle is a neutral pattern, indicating indecision and equal pressure from both sellers and buyers. Although in most cases it signals a trend continuation, it can form ahead of the trend reversal. Next, is the period of the patterns. A symmetrical triangle appears in a longer-term trend and forms for a longer period, while a pennant usually appears in a short-term trend, so it’s smaller than a symmetrical triangle. Also, a pennant has a flagpole, used to define take-profit targets, while a symmetrical triangle doesn’t have it.
How to Construct a Pennant Pattern
Now let’s have a look at real examples of pennant patterns. If you would like to find the formations yourself, consider using the TickTrader trading platform with over 700 markets and 1200 trading tools.
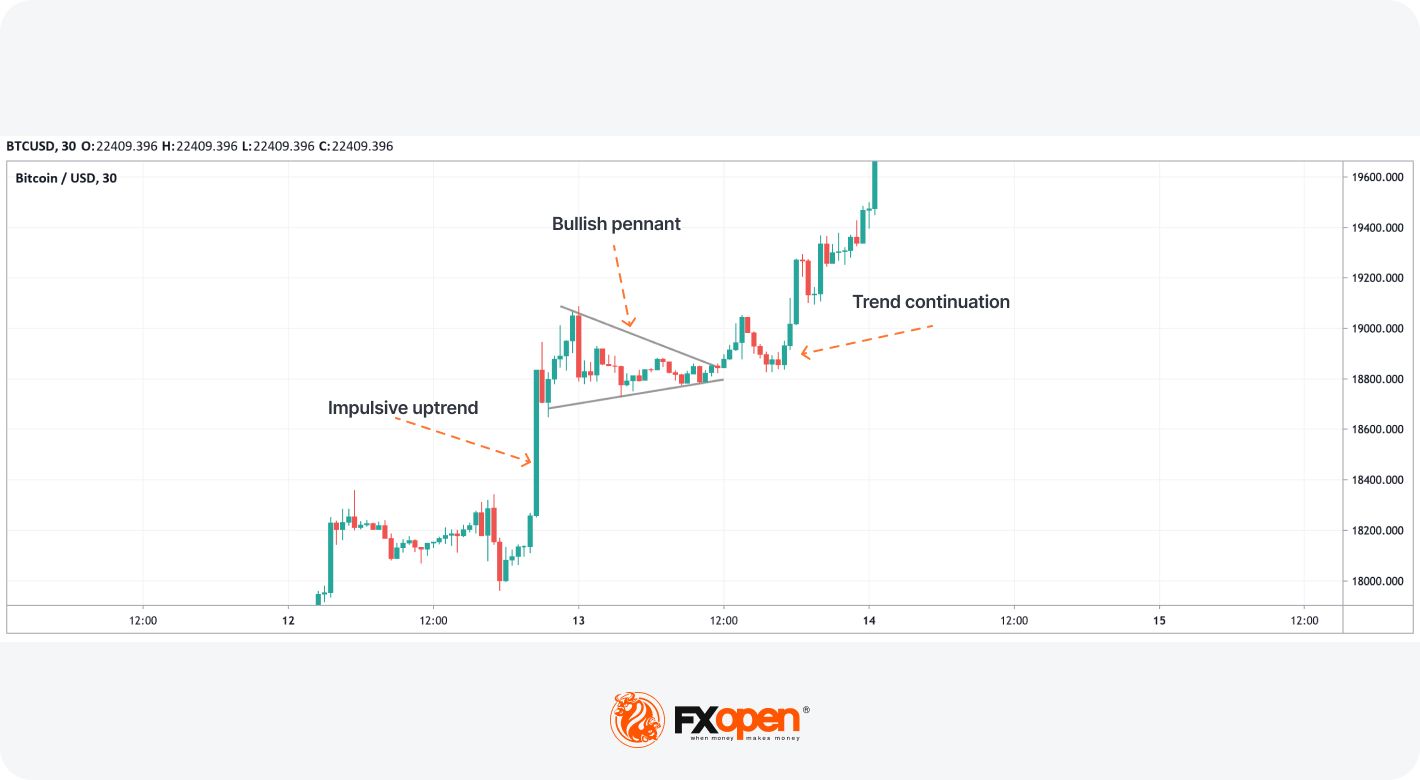
First, we need to identify a clear impulsive move. Looking at the chart of Bitcoin we see a solid rise on 12th January. As the price was in an uptrend, a brief consolidation formed before further continuation.
This short period of sideways movement that served as an area of consolidation is, in this case, a bullish pennant. To construct it, we drew two converging trendlines.
The first trendline was created by connecting lower highs, while the second was drawn through higher lows. It’s important to note the converging trendlines should have equal length. Once the pattern was formed, we anticipated a breakout and further trend continuation.
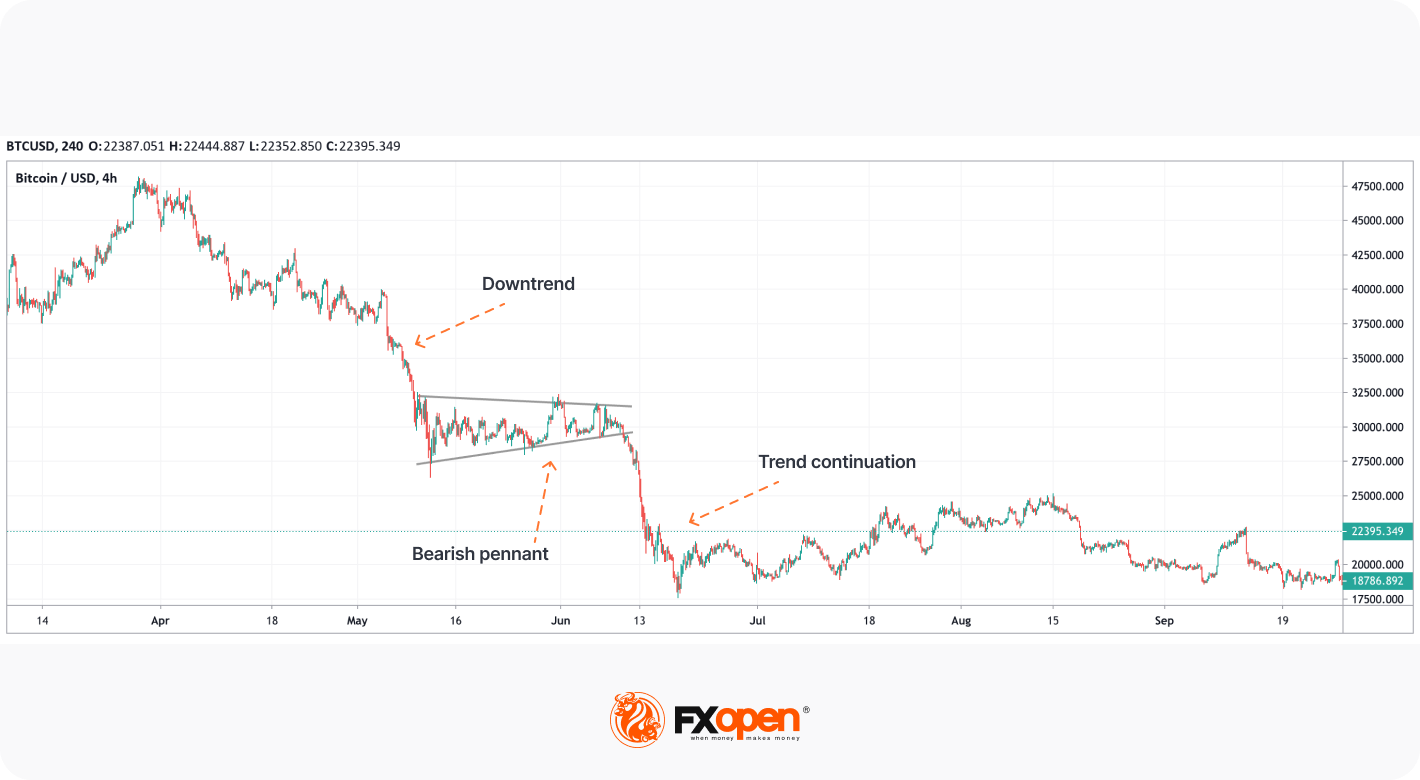
This is the case with the bearish pennant. On the Bitcoin chart above, we determined a period of consolidation after an impulsive move and drew two converging trendlines. After the pennant was formed, a downtrend continued.
A Pennant Pattern: Trading Rules
With an idea of how the pennant works and what it looks like, let’s take a closer look at some pennant trading rules to use the pattern consistently.
Structure
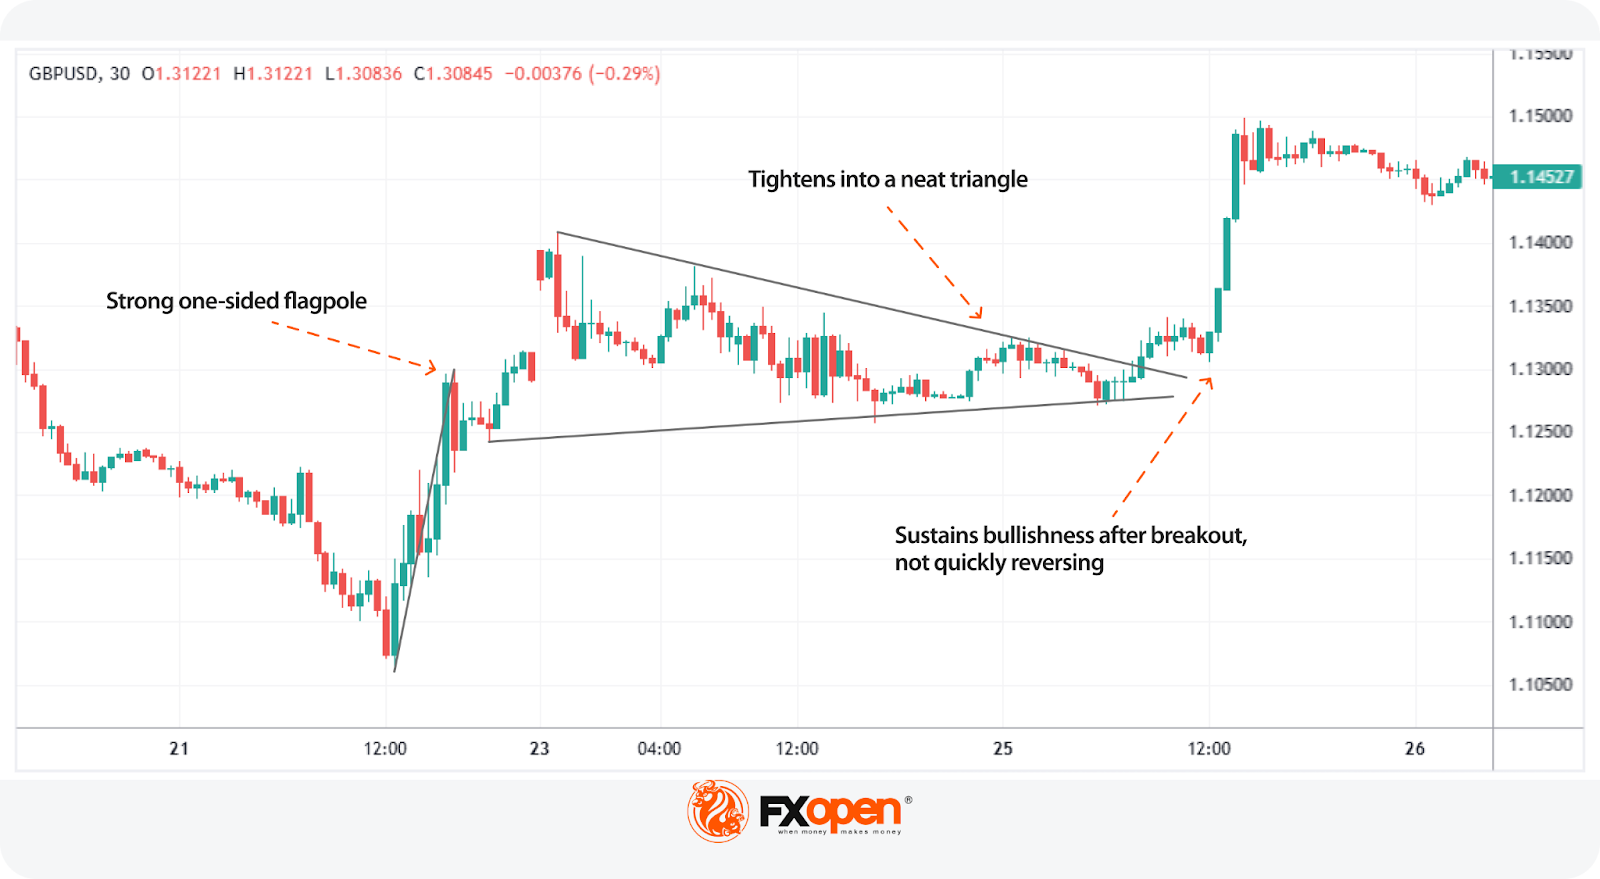
Before anything else, the pennant needs to be clean. Traders look for a sharp, one-sided move—this is the flagpole that shows momentum. Then the price should tighten into a small triangle, with lines of the pennant sloping toward each other. It shouldn’t drift sideways for too long or become messy, because that may invalidate the pattern.
The Breakout
A breakout should occur in the same direction as the flagpole, preferably on a stronger volume. Large candles that show a clear breakout outside of the trendlines are ideal, though persistent but small candles in a given direction are also valid. The danger comes with a fakeout, where the price quickly reverses after breaking out, so traders typically wait for several closes outside of the trendline before making a decision.
Entries and Exits
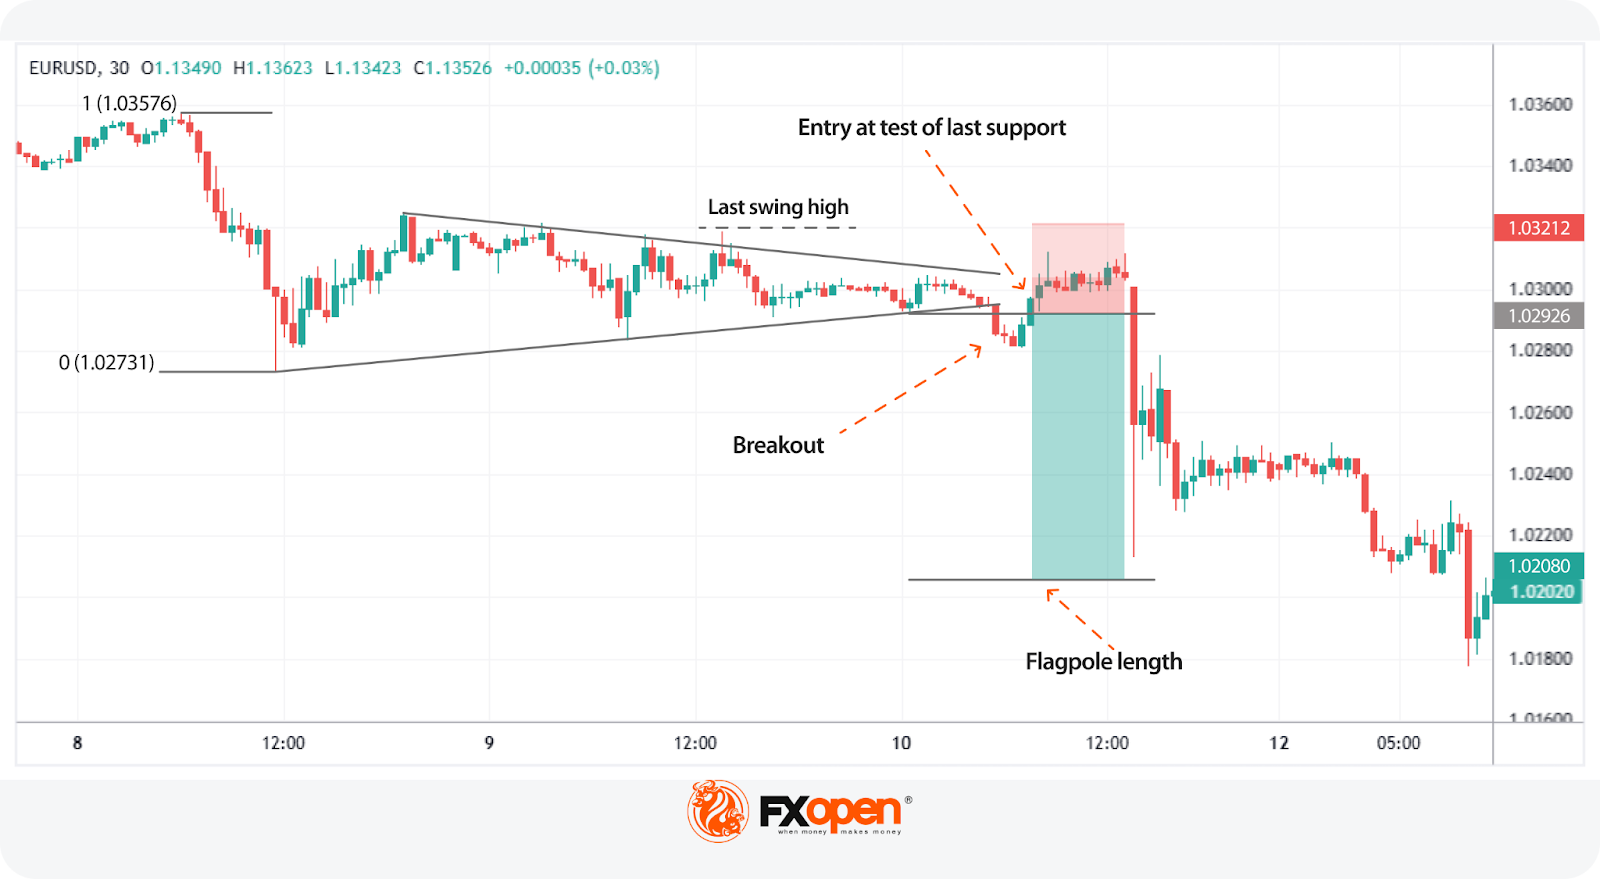
Some traders may enter the market with a market order once the breakout is confirmed, while others might set a limit order at the last small area of resistance (in a bullish pennant) or support (in a bearish pennant).
It’s vital to remember that market conditions are often not perfect—the price may turn around and back, so it’s vital to set a stop-loss level. Stop losses might be set beyond the last significant swing high or low in the pattern.
When it comes to determining a take-profit target, the theoretical rule is to measure the length of the flagpole and project that from the entry point to find a target. Alternatively, some might exit at an area where a reversal is expected, such as a support or resistance level, or at a specific risk/reward ratio like 1:2 or 1:3.
How to Improve Pennant Signals
Like any pattern, the pennant isn’t foolproof. However, there are some ways to potentially improve its reliability.
Aligning With Trend Tools
Pennants are believed to provide stronger signals during strong trends. You can use tools like moving averages to confirm that. For example, if the price is above the 50-period EMA and the pennant forms during a steady uptrend, that adds weight. A breakout that also clears a short-term moving average can strengthen the case.
Momentum indicators can also help. If the RSI sits comfortably above 50 while the pattern forms, or breaks out above 50 alongside the pennant, that can confirm a bullish trend and vice versa. However, if the RSI shows overbought/oversold conditions and the market does look very overstretched, that might be a sign to hold off or manage risk more carefully.
Using Volume as a Filter
Volume can give clues. During the pennant, volume may dry up and signal a pause. However, if the breakout coincides with strong volume, that can show genuine interest as buyers or sellers rush in to take advantage of a possible new trend leg. If it stays low, the move may fail or stall quickly.
Pairing It with Context
A pennant is just part of a broader story. For instance, if the market is bouncing off of a resistance level, creates an impulsive flagpole and then forms a bear pennant, that might add conviction to the pattern. However, if the breakout is straight into a major support level, it might be better to consider looking for a bullish reversal pattern instead.
Alignment between timeframes and correlated assets can be valuable too. If a pennant on the 1-hour chart occurs during a larger trend on the daily, that may add weight. Likewise, if there’s a bullish pennant forming on EUR/USD while dollar weakness is apparent across the board, there may be a greater probability that the bullish breakout is genuine.
Advantages and Limitations
Pennants are useful in strong trending markets, but they’re not perfect. Let’s take a look at the formation’s advantages and disadvantages.
Advantages
- Clear Structure: Pennants have three clear parts — the sharp flagpole, the tight consolidation, and the breakout offer a straightforward sequence.
- Works Across Timeframes: Pennants occur on many timeframes: from 5-minute charts to daily or weekly ones. That makes them useful for numerous kinds of strategies.
- Defined Breakout Levels: The converging trendlines naturally give a clear area to watch for breakout behaviour.
Limitations
- False Breakouts: Breakouts that stall quickly can trap traders, especially in choppy markets.
- Easily Confused: A messy pennant can look like a triangle or flag. If the structure isn’t clean, the signal can be harder to interpret.
- Relies on Existing Trend Strength: If the initial move is weak or inconsistent, the pennant can be less meaningful. It needs momentum to have the highest probability of working out.
Common Mistakes of the Pennant Pattern
Pennants can be effective, but traders may misread them or jump in too early. Common mistakes that traders might make can include:
Forcing the Pattern
Not every consolidation is a pennant. If the lines don’t converge, or if the move before it wasn’t sharp and one-sided, it’s probably not a pennant. Forcing the pattern can lead to poor results.
Trading Before the Breakout
Acting inside the pennant, without confirmation, often means making a wrong decision. The pattern only matters once the price breaks cleanly.
Losing the Bigger Picture
A pennant ahead of major resistance/support or against the broader trend weakens the setup. Context always matters more than the shape alone.
Final Thoughts
The pennant pattern is a valuable tool, which provides useful insights into potential price trends. However, it may provide false signals; therefore, to trade with a pennant, you need to be familiar with technical analysis and be able to interpret charts.
Once you are ready to implement the pennant pattern into your trading approach, consider opening an FXOpen account and enjoy fast-speed trade execution, tight spreads from 0.0 pips, and low commissions from $1.50. Good luck!
FAQ
What Is a Pennant Pattern?
The pennant meaning refers to a short-term continuation setup that forms after a sharp price move. It’s made up of a brief consolidation phase with converging trendlines, then followed by a breakout in the same direction as the original move. It can signal an impending continuation trend leg.
How to Trade a Pennant Pattern?
Traders usually wait for the price to break out of the pennant, ideally on rising volume, in the same direction as the initial move. The height of the flagpole is typically used as a rough target, while stop losses are set beyond the last swing high/low.
What Happens After a Bullish Pennant?
A bullish pennant typically leads to further upside if the price breaks above the pattern’s upper trendline with strong momentum.
What Is the Difference Between a Bull Flag and a Bull Pennant?
Bull flags and bull pennants both follow strong upward moves and signal a trend continuation. The key difference between a pennant and a flag is structure. The price in a flag drifts lower or moves sideways within parallel lines that form a sloping or horizontal channel. The price in a pennant contracts into a small symmetrical triangle with converging trendlines.
*Important: At FXOpen UK, Cryptocurrency trading via CFDs is only available to our Professional clients. They are not available for trading by Retail clients. To find out more information about how this may affect you, please get in touch with our team.