Nasdaq 100: A New All-Time High

As shown on the Nasdaq 100 chart (US Tech 100 mini on FXOpen), the value of the technology stock index has risen above its February peak, setting a new historical high.
Bullish sentiment may be supported by:
→ Easing concerns over potential US involvement in a Middle East war, as the ceasefire between Israel and Iran remains in effect.
→ Media reports suggesting that Donald Trump is considering replacing Federal Reserve Chair Jerome Powell by September or October, in an effort to influence a rate cut that could accelerate economic growth (though this also raises the risk of a new inflationary wave).
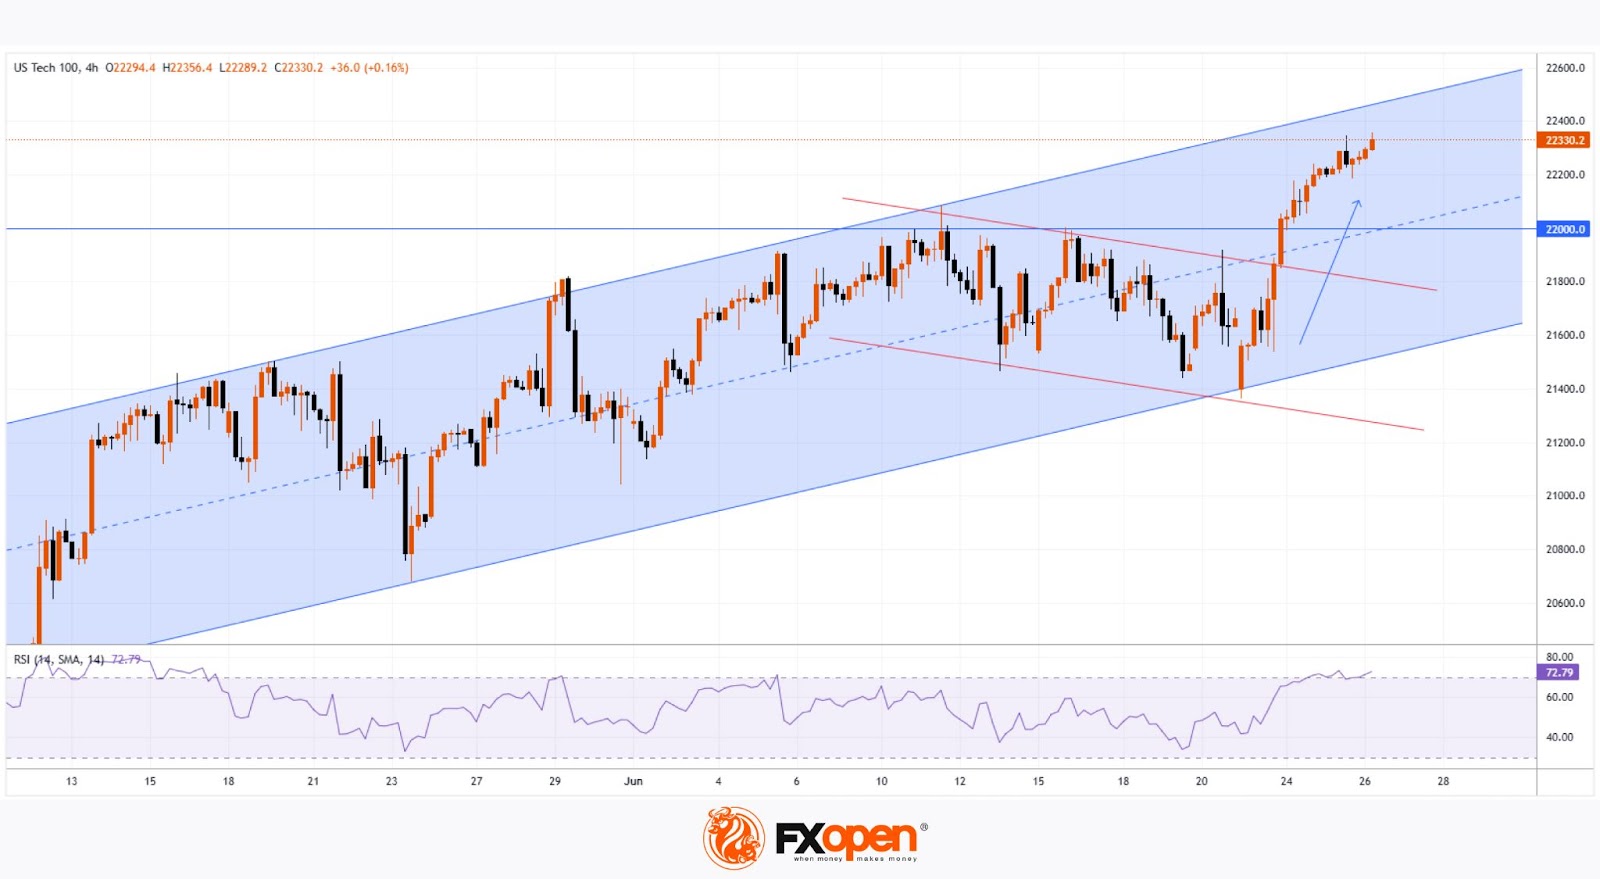
Technical Analysis of the Nasdaq 100 Chart
Price fluctuations in May and June have formed an ascending channel (highlighted in blue), with the following observations:
→ The decline (marked by red lines) appears to be an interim correction forming a bullish flag pattern;
→ The 22K level, which acted as resistance mid-month, was breached by a strong bullish impulse (indicated by the arrow) from the week’s low.
This leaves the market vulnerable to a potential correction, which seems possible given:
→ Proximity to the upper boundary of the ascending channel;
→ Overbought conditions indicated by the RSI.
If the market corrects, a retest of the 22K level may happen.