Litecoin Surges Past Descending Resistance – Bulls Target $97.10 Level
Litecoin (LTC) is back in the spotlight as bullish momentum sweeps across the crypto market. After months of volatility and sideways action, Litecoin is showing signs of strength, pushing above key technical levels and attracting fresh investor interest. The broader market recovery, fueled by optimism in Bitcoin and Ethereum, has created favorable conditions for altcoins to regain traction, and Litecoin could be one of the biggest beneficiaries.
Top analyst Carl Runefelt recently shared a technical analysis highlighting a major development: Litecoin has broken above a key level on the daily chart. This breakout is a critical technical signal, suggesting a potential trend reversal after weeks of consolidation and indecision. While resistance remains overhead, analysts believe that a confirmed reclaim of this level as support could trigger an expansive phase for LTC, opening the door to strong upside moves.
As institutional interest in crypto grows and macroeconomic conditions stabilize, assets like Litecoin—known for speed, low fees, and high liquidity—may attract attention from traders and investors seeking asymmetric returns. With momentum on its side and market sentiment shifting, the coming days will be crucial to determine whether Litecoin can turn this breakout into a full-scale rally.
Litecoin Bullish Momentum And ETF Hopes Fuel Rally
Litecoin (LTC) is gaining bullish traction as price action strengthens and investor sentiment improves across the crypto market. Currently trading above $90, Litecoin has broken out of its downward trend, signaling renewed buying interest and technical strength. This move is particularly significant, given months of sideways consolidation and the broader market’s gradual recovery.
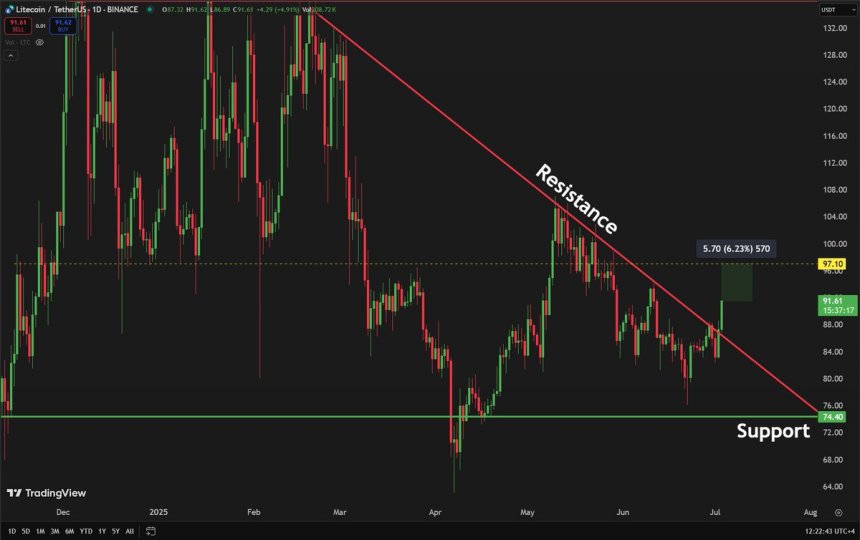
According to Carl Runefelt, Litecoin has decisively broken above its descending resistance on the daily chart—a bullish technical setup that could pave the way for further gains. Runefelt believes the next target is $97.10, a level that, if reached and held, could mark the start of a new upward leg for LTC. The recent breakout has reignited interest in Litecoin’s medium-term prospects, especially as traders look for altcoins with momentum and untapped upside.
Adding to the optimism is speculation surrounding a potential Litecoin spot Exchange-Traded Fund (ETF). According to Bloomberg, the probability of approval for a Litecoin spot ETF by October 2 (local time) has risen to an impressive 95%. Such a product would offer institutional investors a new and regulated vehicle to gain exposure to LTC, potentially unlocking significant inflows.
With favorable technicals and strong fundamentals aligning, Litecoin appears poised for a breakout. The coming days will be critical as bulls aim to confirm support above $90 and push toward the $97.10 resistance. If ETF approval expectations continue to build alongside broader market momentum, Litecoin could emerge as one of the top-performing altcoins of the current cycle.
LTC Price Action: Key Levels To Reclaim
Litecoin (LTC) is showing strong bullish momentum after breaking above a key descending resistance level on the daily chart. As seen in the chart, LTC surged over 4% in the last session, closing at $91.23. This breakout follows weeks of tight consolidation near the $85 zone and signals growing interest as market sentiment improves across the board.
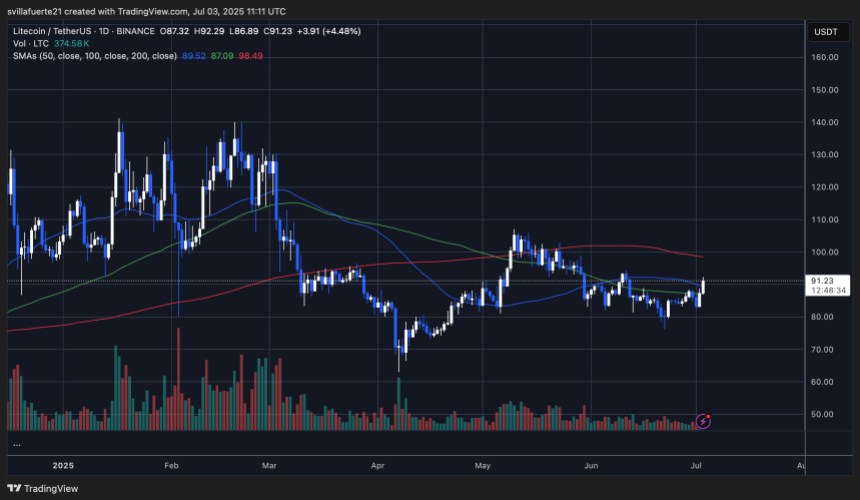
Price has now moved decisively above the 50-day and 100-day moving averages, which have acted as resistance in recent weeks. The next challenge lies at the 200-day moving average, currently near $98.50, which aligns closely with the analyst-projected target of $97.10. Reclaiming that level would confirm a full trend reversal and open the door to testing the $100 psychological level.
Volume has also picked up, supporting the breakout and suggesting that buyers are stepping in. If bulls maintain momentum and consolidate above $90, Litecoin could confirm a shift in market structure and set the stage for a broader rally. On the downside, any rejection at the 200-day MA could trigger a retest of the $87–$89 support area.
Featured image from Dall-E, chart from TradingView