Bitcoin Price Tests the $100k Level for Resilience

The Israeli attack on Iran on 13 June, followed by retaliatory strikes and belligerent rhetoric from officials, has acted as a bearish driver for the cryptocurrency market. US bomber strikes on Iran over the weekend further worsened the situation for coin holders.
Over the weekend, the price of Bitcoin fell by around 10% from its early June peak, reaching its lowest point in one and a half months. Other cryptocurrencies displayed even stronger bearish momentum on their charts.
Amid rising geopolitical tensions and the prospect of prolonged US involvement in a Middle Eastern conflict, the US dollar has traditionally strengthened – which has also put pressure on the BTC/USD rate.
As a result, the Bitcoin price briefly dipped below the key psychological level of $100k but has since rebounded, effectively testing this level’s strength. How might events unfold from here?
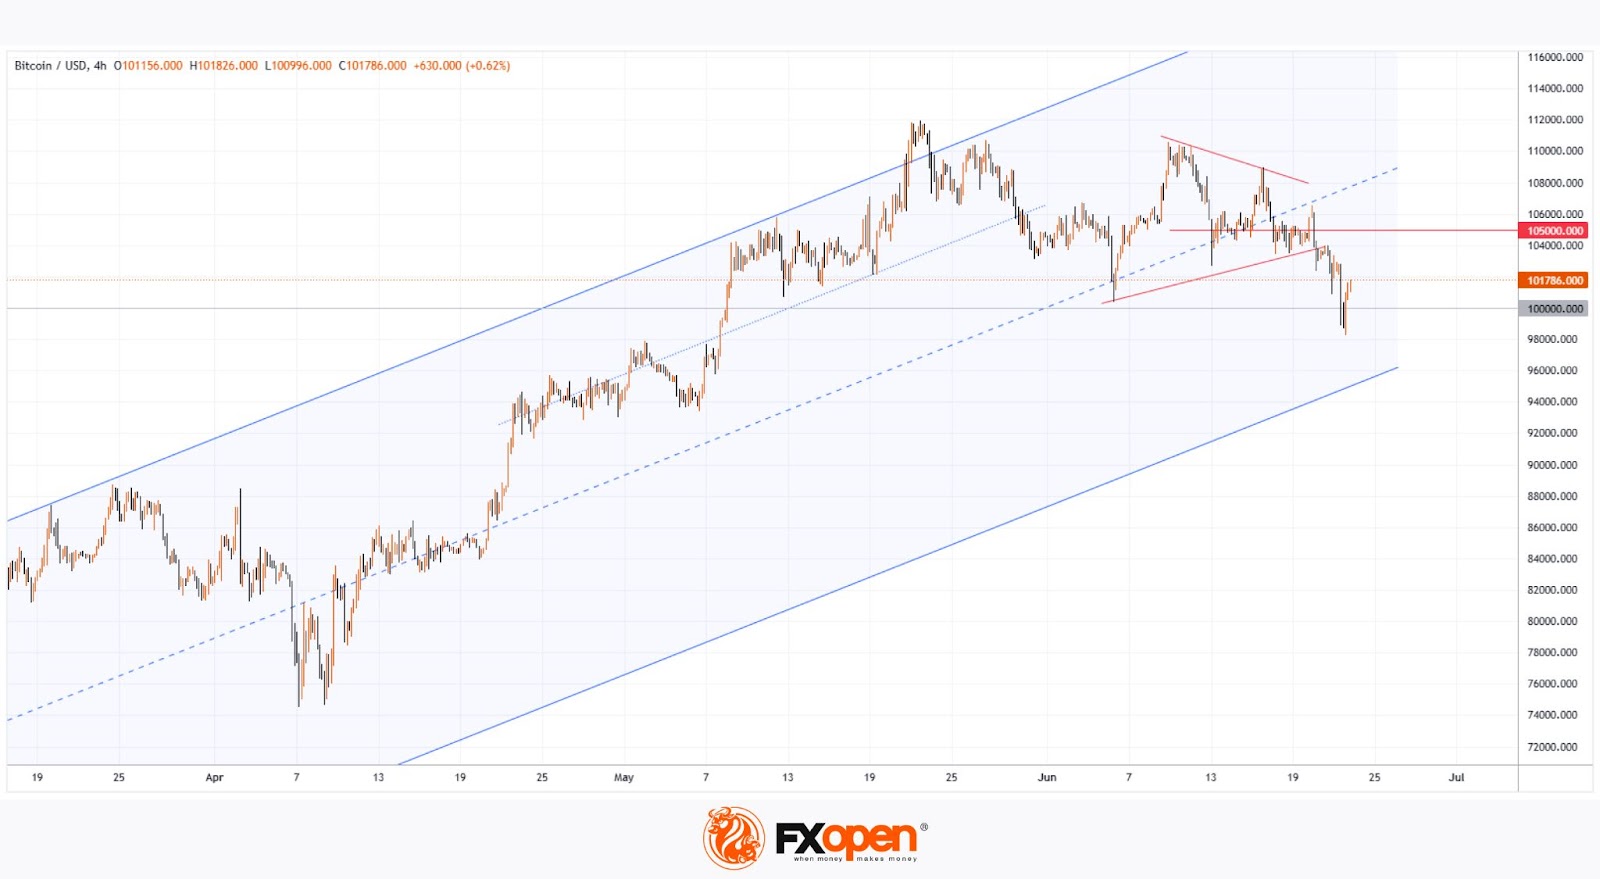
Technical Analysis of the BTC/USD Chart
The chart shows that Bitcoin’s price movements have formed an ascending channel (marked in blue). In mid-June, a contracting triangle pattern (marked in red) appeared around the channel’s median line – this can be interpreted as a sign of balance and agreement between buyers and sellers near the $105k level.
However, that balance has now been disrupted, with the bulls retreating. It is reasonable to assume that the $103k level, where the bears broke through the lower boundary of the red triangle, will act as resistance going forward.
Should the military conflict in the Middle East escalate, another bearish assault on the psychological $100k mark on the BTC/USD chart is not out of the question – for now, it appears to be holding as a strong support level.