Bitcoin LTH Average Profits Hit 215% – Major Sell-Off Around The Corner?
Bitcoin has traded within a narrow range between $107,500 and $109,600 since last Friday, with volatility drying up as bulls and bears battle for control. This kind of price compression typically precedes a significant move, and traders are closely watching for the breakout. Some analysts believe Bitcoin is preparing to push above its all-time high near $112,000, fueled by strong fundamentals and persistent demand. Others, however, remain cautious and expect more consolidation before a clear trend emerges.
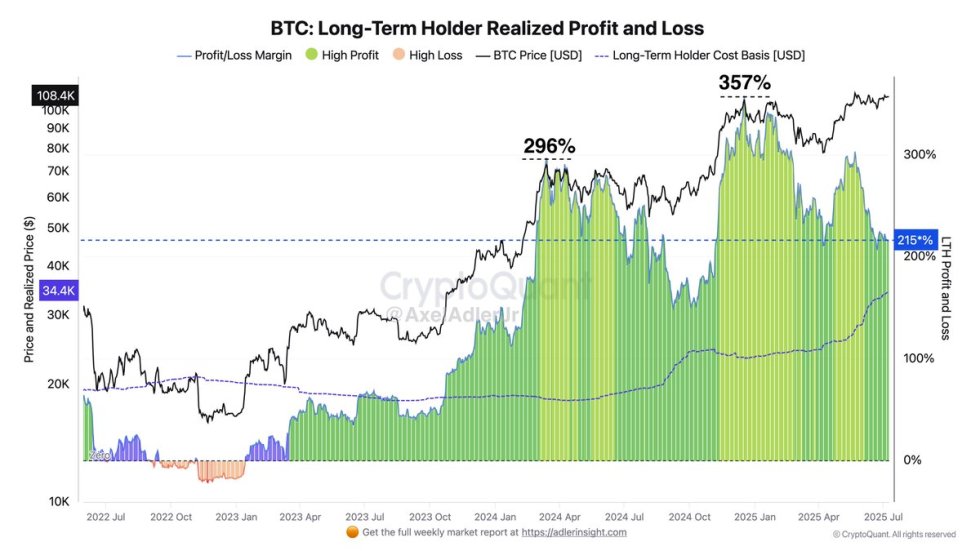
On-chain data from CryptoQuant reveals that long-term holders (LTHs) are currently sitting on an average unrealized profit of 215% above their cost basis. Historically, when these investors reach over 300% profit, they begin to gradually distribute their holdings back into the market. This places BTC in a zone of orderly profit-taking, not quite euphoria, but with a growing risk of a shift in behavior.
Whether the next move is a breakout or breakdown, the pressure is building. Bitcoin’s resilience above $107,000 continues to attract bullish attention, but only a strong push above the range will confirm momentum. Until then, market participants remain on edge, waiting for Bitcoin to pick a direction that could define the weeks ahead.
Long-Term Holders Reach Critical Zone: Bitcoin Tests Patience
Bitcoin’s recent price action has frustrated many investors, as the market continues to drift sideways in low volatility. After weeks of trading within a narrow range, market participants are beginning to lose patience. The prolonged consolidation presents downside risk if momentum fails to return soon. Despite this, the broader macroeconomic backdrop remains favorable. The U.S. stock market recently reached new all-time highs, and geopolitical tensions have eased, suggesting a supportive environment for risk assets like Bitcoin in the months ahead.
Top analyst Axel Adler shared insights pointing to a crucial on-chain signal — long-term holders (LTHs) are currently sitting on an average unrealized profit of 215% above their cost basis. Historically, when this metric crosses 300%, it marks a level where seasoned holders begin to distribute coins into strength. At 215%, the market is in the “orderly profit-taking” zone — not yet euphoric, but approaching levels that have historically led to increased sell pressure.
This on-chain signal suggests that while a breakout remains possible, upside may be limited unless new demand steps in. If the rally fails to extend soon, there’s a growing risk that long-term holders could begin offloading positions prematurely. This dynamic creates a delicate balance — bulls need to ignite momentum to attract new capital, or else risk seeing supply overwhelm price. For now, all eyes remain on $112,000 as the key level that could define Bitcoin’s next major move.
BTC Stuck Below Resistance
Bitcoin remains tightly range-bound between $107,500 and $109,600, with volatility continuing to compress as bulls attempt to push the price above resistance. As shown in the 8-hour chart, BTC has tested the $109,300 zone multiple times without managing a decisive breakout, suggesting strong selling pressure at this level. On the downside, the 50-, 100-, and 200-period moving averages (SMA) at $107,489, $106,572, and $105,448, respectively, continue to act as dynamic support levels.
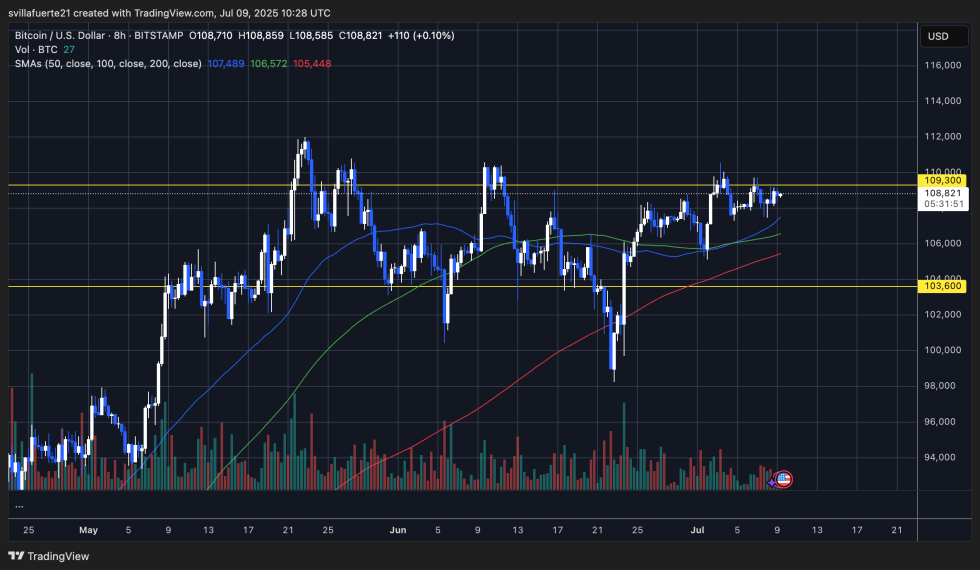
Volume remains muted, signaling a lack of conviction from both bulls and bears. The longer BTC stays within this tight range, the more violent the eventual breakout could be. The price is currently hovering above all major SMAs, which is typically a bullish signal, and each dip toward the $107K zone has been met with buyer support.
If buyers manage to reclaim $109,300 with volume confirmation, Bitcoin could quickly revisit the all-time high near $112K. However, failure to hold above the moving averages could send BTC down to retest $103,600 — a key support level from late June. Overall, Bitcoin’s structure suggests that a significant move is coming, but directionality will depend on whether bulls can break resistance or bears regain momentum.
Featured image from Dall-E, chart from TradingView