Bitcoin Price Has Neared $90,000 Mark

When analysing the BTC/USD chart on 6 November, we observed the following:
→ News regarding Trump’s win and his campaign promises to support the crypto sector have likely contributed to Bitcoin’s rising value.
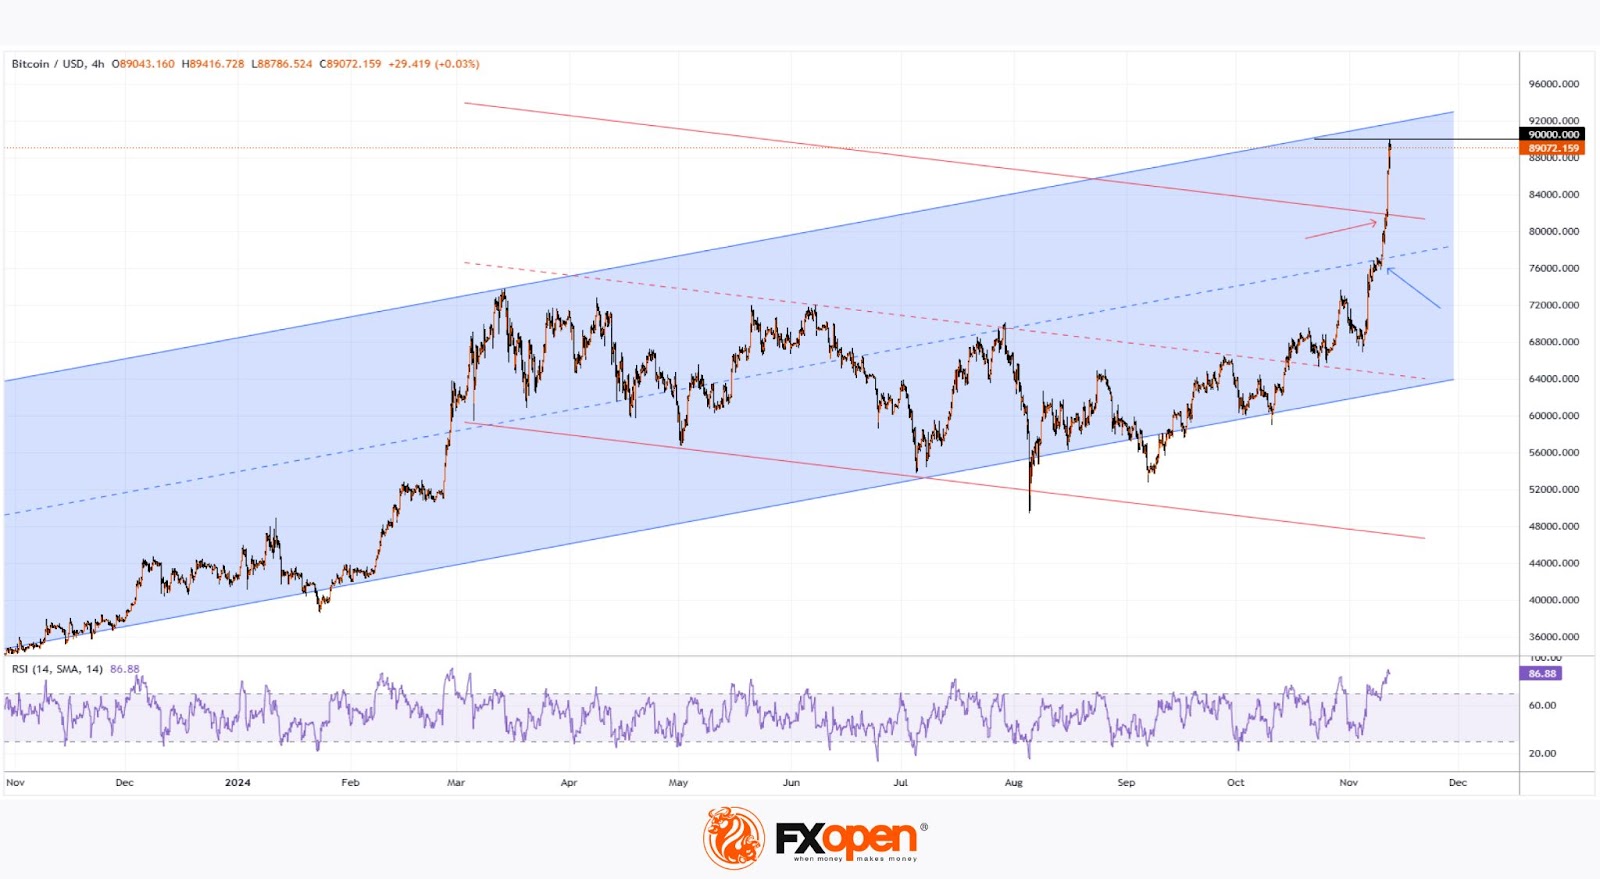
→ We noted Bitcoin’s continued movement within a long-term ascending channel (indicated in blue), which has contained the price trend through 2024.
→ We identified a resistance level (marked by the top red line) that could present an obstacle in the cryptocurrency’s upward momentum.
Since then, in just six days, Bitcoin’s price has surged by approximately 20%. Specifically:
→ The red arrow shows how the red line’s resistance level briefly held back the bulls, only for the price to break through and accelerate upward.
→ The blue arrow marks a period of price consolidation, suggesting a temporary balance between buyers and sellers and a possible adjustment to the blue channel, positioning the median line here.
With bulls firmly in control, will this rally pause? According to a technical analysis of the BTC/USD chart, Bitcoin now approaches a significant resistance zone formed by:
→ The upper boundary of the long-term ascending channel.
→ The psychological $90,000 level.
A minor breakout above this psychological level is possible, which may then set the stage for a correction—a plausible outcome given that the RSI has reached an eight-month high.