RSI Indicator Explained: How to Use the Relative Strength Index in Trading

What is the Relative Strength Index? The relative strength index is one of the most common oscillators. Many traders prefer it to other momentum indicators because it provides numerous signals and can be used in different timeframes and for various assets with minor changes in its settings. In this FXOpen article, you will learn what the RSI is and how to use it in trading strategies.
What Does Relative Strength Index Mean?
The relative strength index (RSI) is a momentum indicator. It was developed by J. Welles Wilder Jr. and presented for the first time in 1978 in his book entitled New Concepts in Technical Trading Systems. The indicator was introduced as a tool for identifying overbought and oversold market conditions by measuring the speed and magnitude of recent price changes. Today, traders use it to identify overbought/oversold conditions, divergences, and trends.
Wilder developed some other popular technical analysis indicators, including the average true range (ATR), the average directional movement index (ADX), and the parabolic stop and reverse (Parabolic SAR).
What Does It Look Like?
The RSI is an oscillator, which means it’s plotted below the price chart, so it doesn’t interact with the price itself. It includes only one line that moves within the 0-100 range.
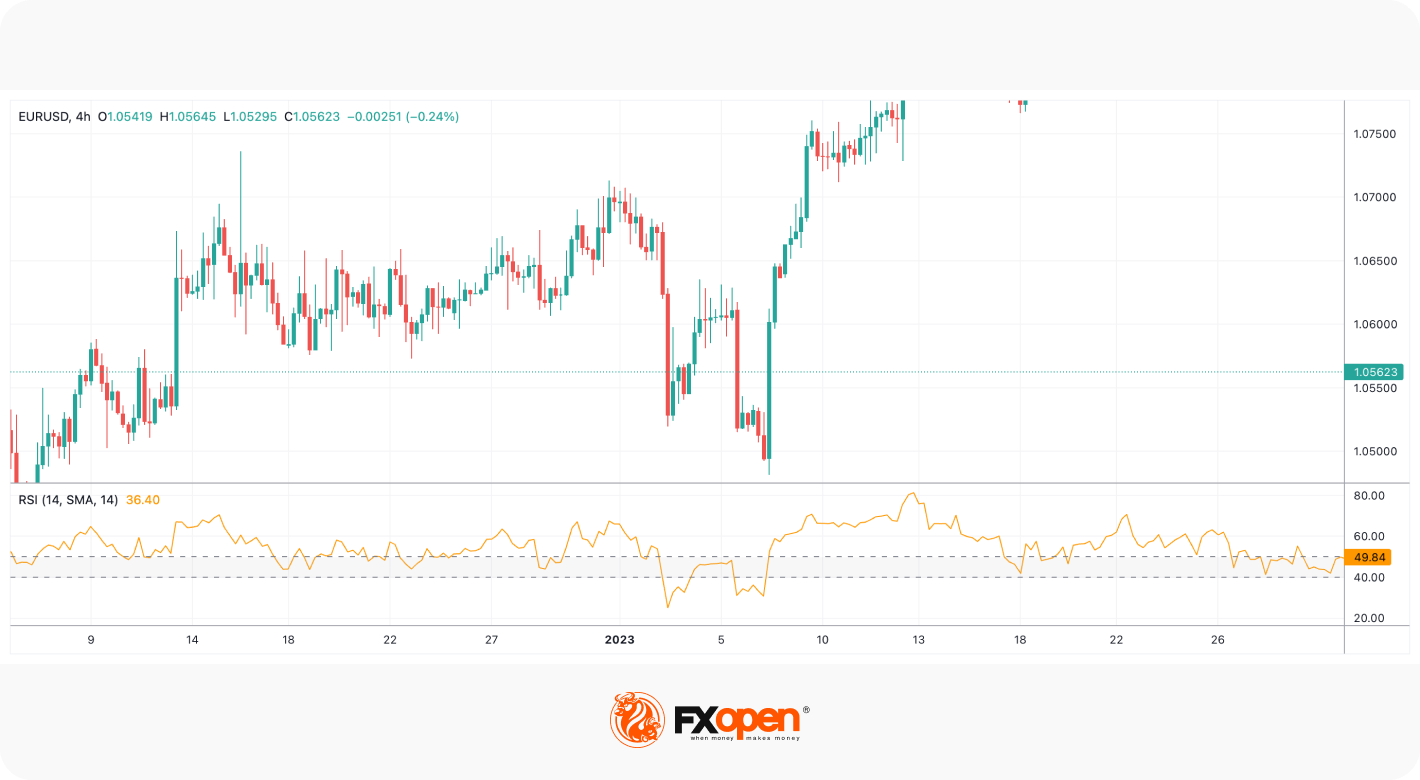
A common question is, ‘What is RSI in stock charts?’ It’s the same as in commodity, currency pairs, and cryptocurrency* charts. Below you can find examples of the RSI in the chart of Amazon stocks and the EUR/USD pair.
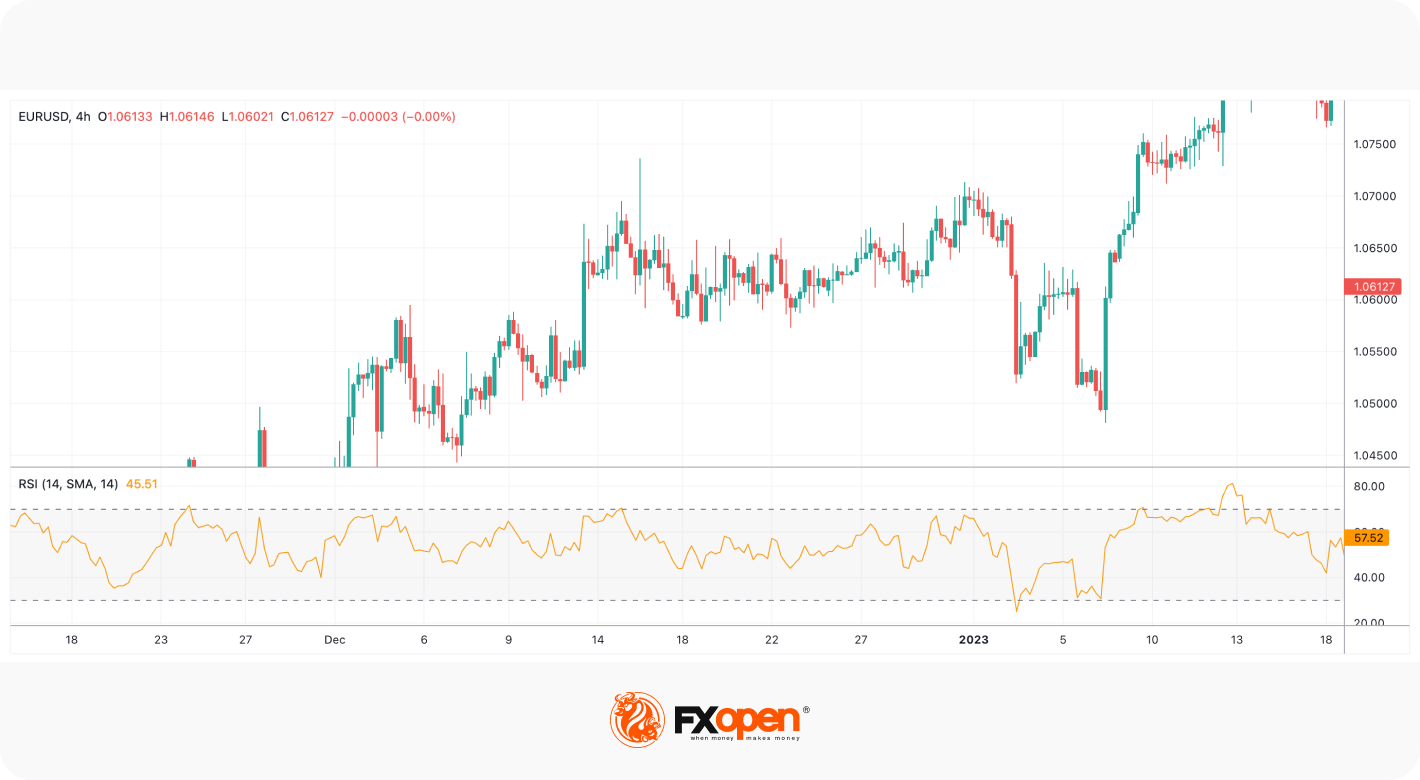
An example of the RSI for forex
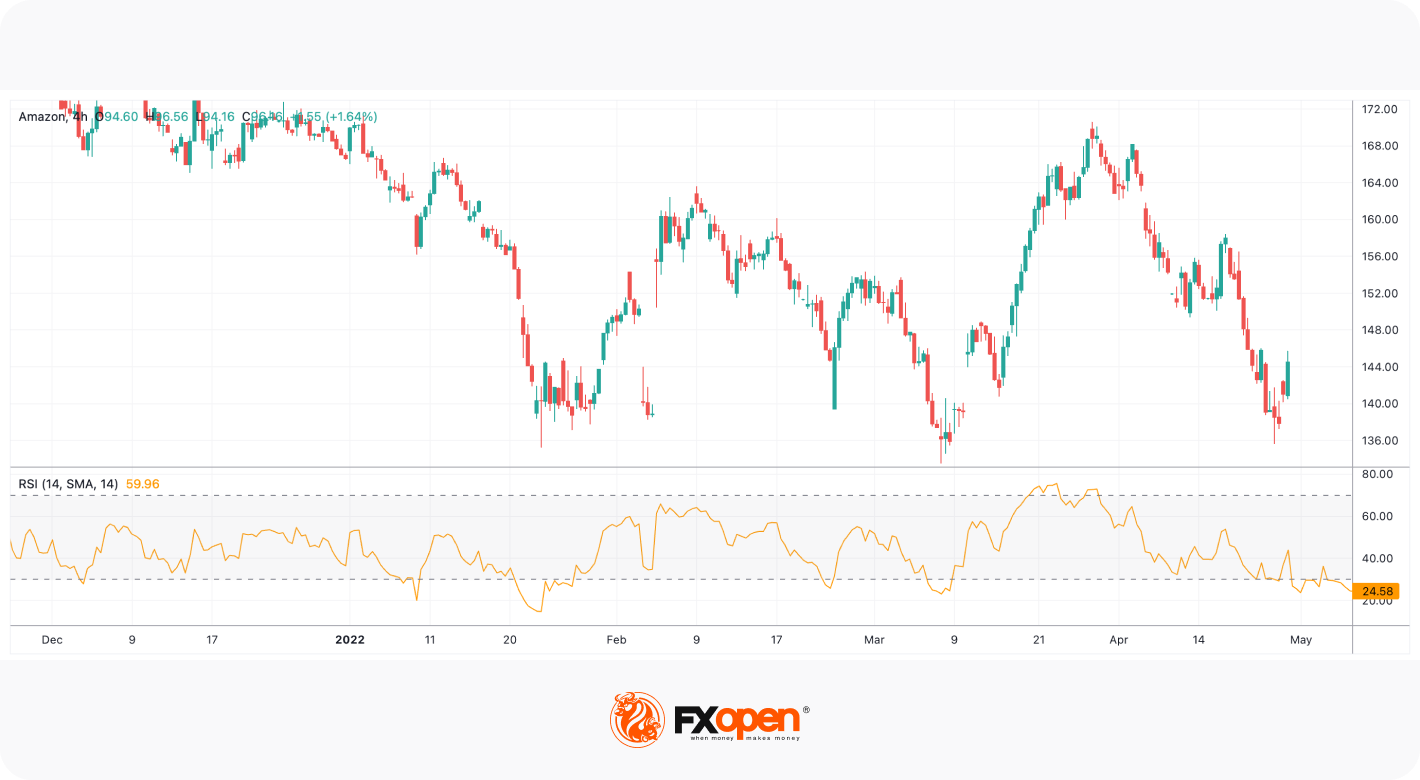
An example of the RSI for stocks
How Is the RSI Calculated?
It’s quite difficult to calculate the RSI. Fortunately, you don’t need to do it manually, as it’s one of the standard indicators implemented in most trading platforms. For instance, you can use TickTrader to examine the RSI without making complicated calculations.
However, it’s worth understanding how the indicator is measured to know which metrics can affect its performance.
The RSI Formula Explained
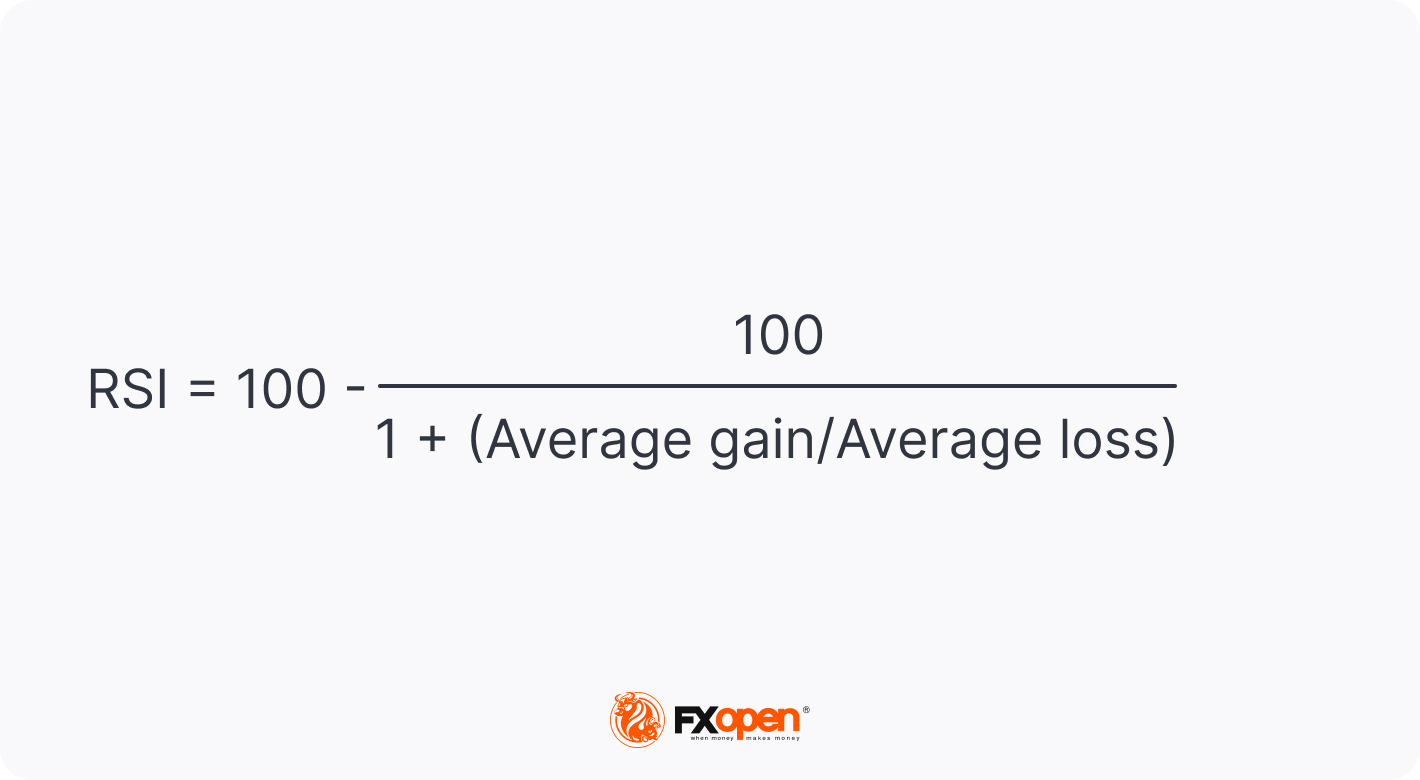
RSI formula
The most popular RSI period is 14, meaning its values are based on closing prices for the latest 14 periods, regardless of the timeframe. We will use this period as an example of RSI calculations.
Step 1: Average Gain and Average Loss
To calculate average gains and losses, you need to calculate the price change from the previous period.
Note: If the current price is higher than the previous one, add the gain to a total gain variable. If the price declined from the previous period, add the figure to a total loss variable.
After you calculate the change for all 14 periods, you need to add up the gains and divide them by 14 and sum up the losses and divide the total by 14.
Step 2: Calculate the Relative Strength (RS)
RS = Average Gain / Average Loss
To calculate the relative strength, divide the average gain by the average loss.
Step 3: Calculate the RSI
Now that you calculated the RS, you can proceed with the RSI value. For this, you need to add 1 to RS, divide 100 by the sum, and subtract the result from 100.
Relative Strength Index = 100 – 100 / (1 + RS)
How to Interpret the RSI Indicator
Aside from identifying overvalued and undervalued assets, the oscillator helps traders determine trend reversals and corrective pullbacks. Also, you can get buy and sell signals using the RSI indicator.
Relative Strength Index: Overbought/Oversold Indicator
Want to learn how to read the RSI indicator signals? The common rule is that when the oscillator is below 30, the asset is oversold, so the price is expected to rise soon. Conversely, when the price rises above 70, the asset is overbought, and the price should fall soon. Traders usually buy when the oscillator rises above 30 and sell when it falls below 70.
Still, it’s vital to remember that a cross of a particular level doesn’t actually mean the price will reverse immediately.
On the daily chart of the GBP/USD pair, the RSI entered the oversold area on 22nd April, left it for a while on 4th May, but returned to it and continued moving upwards only on 15th May.
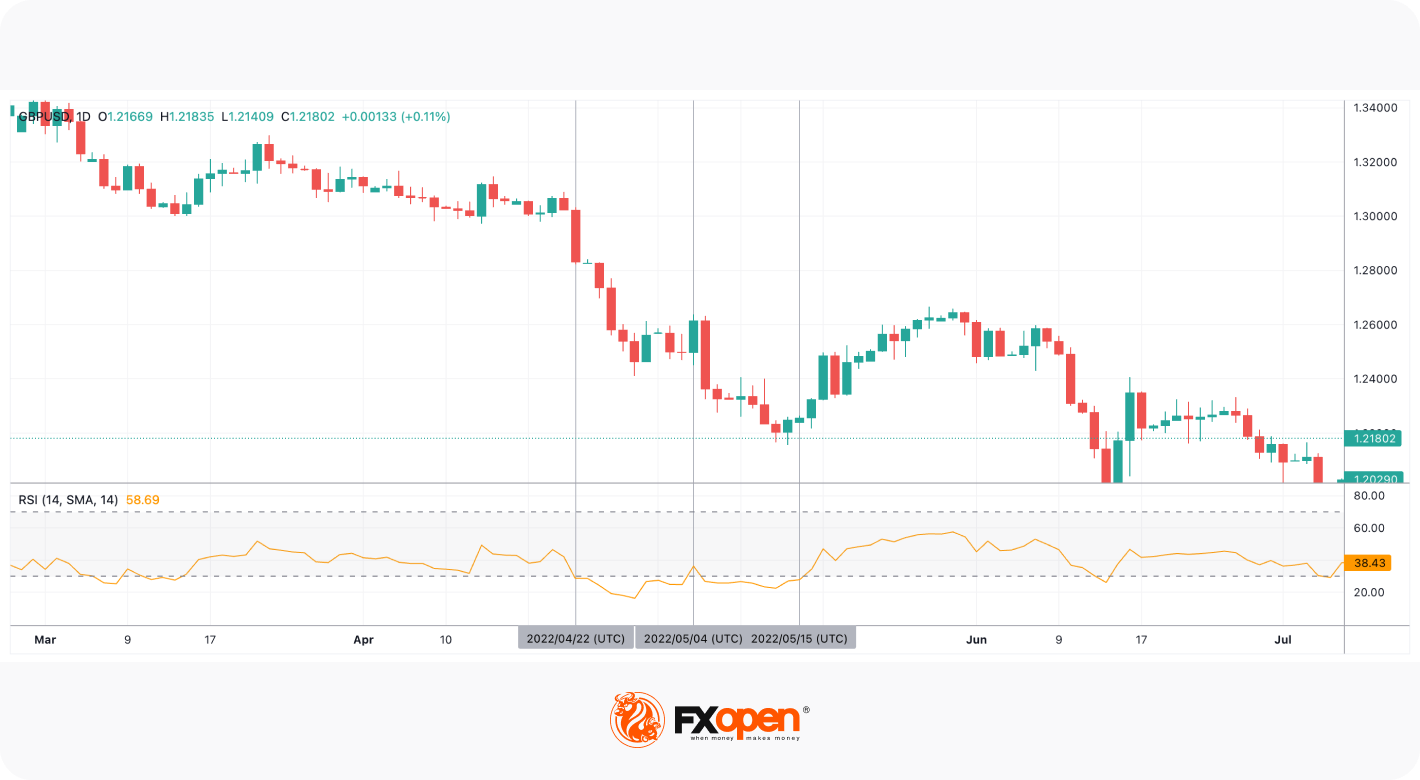
An example of the oversold RSI
Additionally, when using overbought/oversold signals, traders keep in mind that they can reflect an upcoming correction, not a trend reversal. The GBP/USD pair was trading in a strong downtrend, and the RSI provided a signal of a short-term correction only.
To distinguish between corrections and reversals, traders combine the RSI with other tools. A cross of a moving average can confirm a change in the trend.
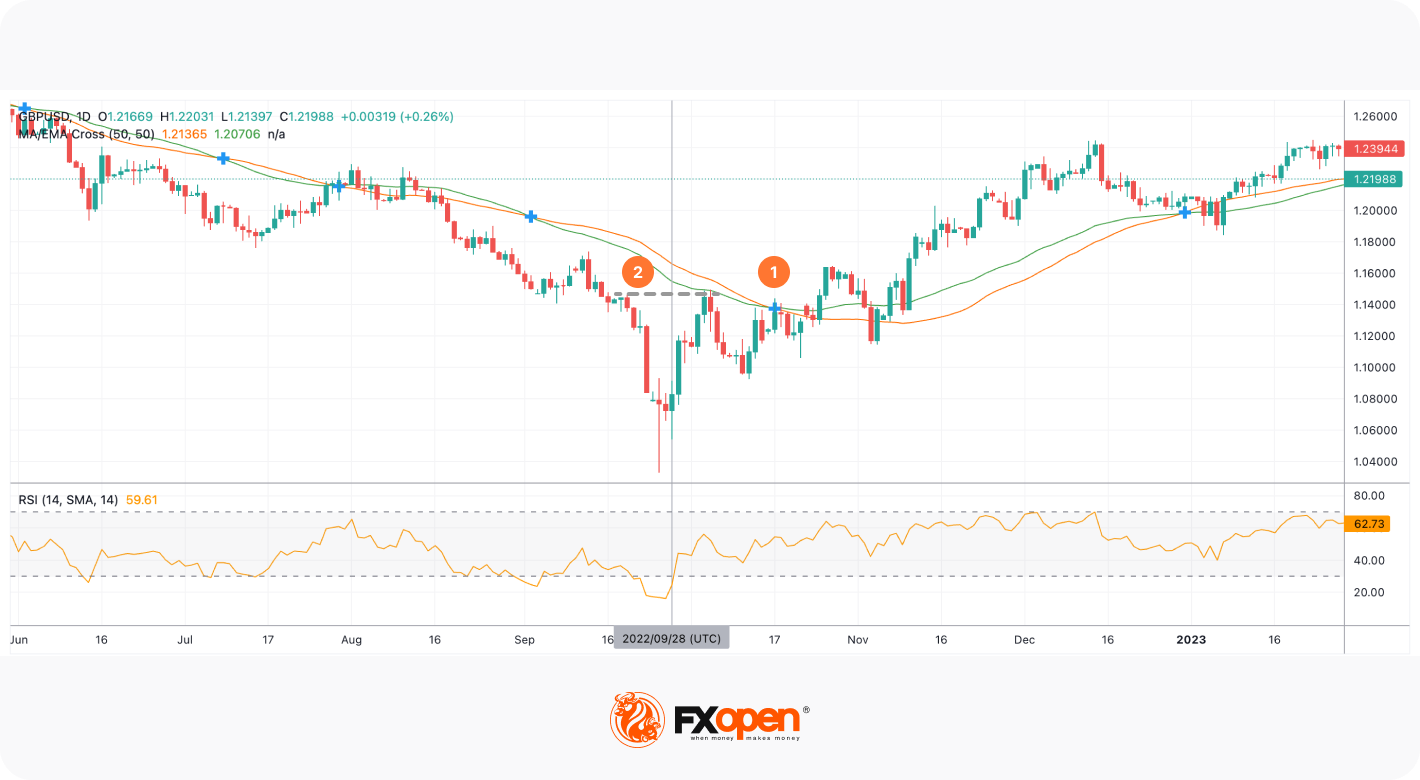
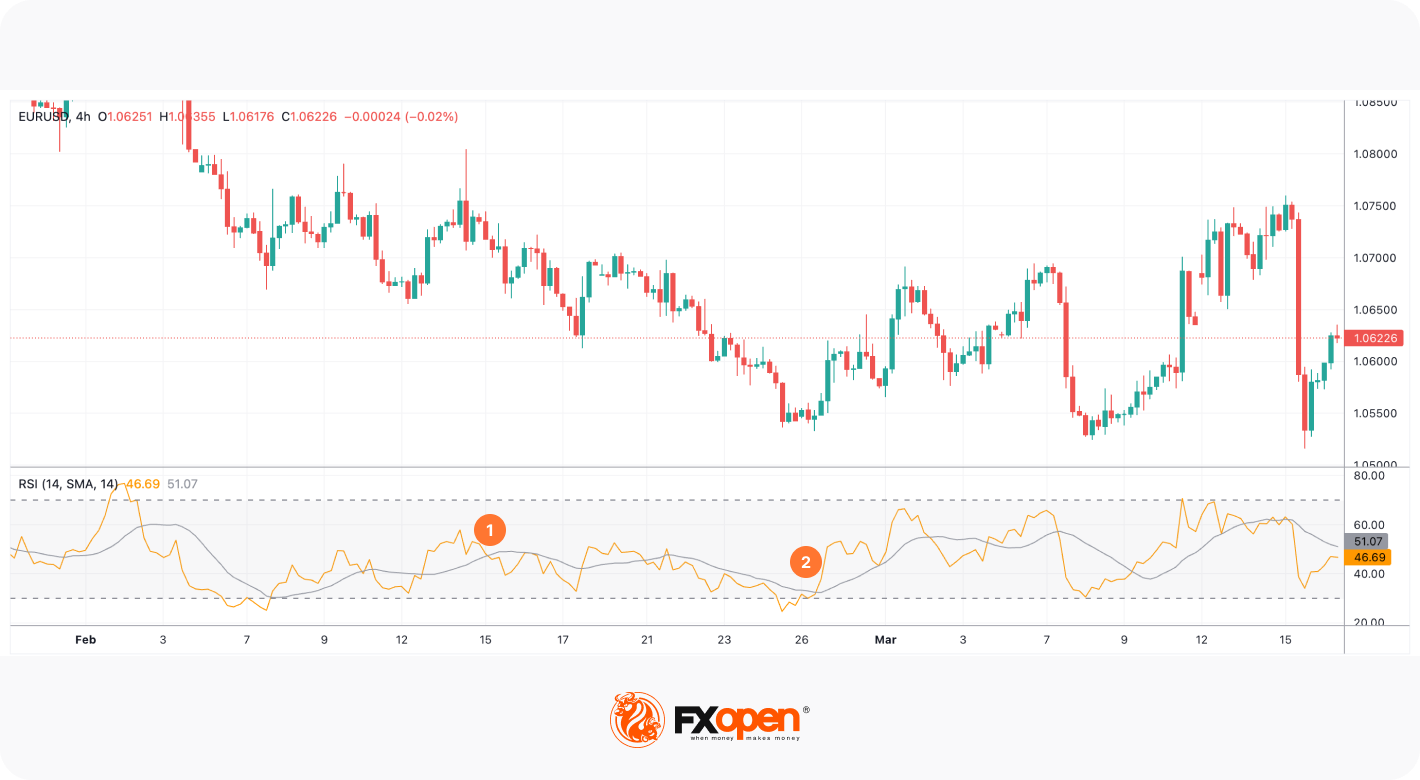
Oversold RSI strategy
On the chart above, the RSI broke above the 30 level on 28th September. A trader could go long, using a trailing take profit. After the MA/EMA cross occurred (1), a trader could trail the take-profit target. Another option would be to place the take-profit order at the closest resistance level (2) and wait for the cross to confirm the reversal signal. After the confirmation, a trader could open another buy position and drive the uptrend.
How to Use RSI Divergence in Trading
Another option for using the RSI is to look for divergences between the indicator and the price chart. The rules are:
Regular divergences:
- Bullish. When the price moves down, forming a lower low, but the relative strength index moves up with higher lows, this is an RSI bullish divergence; the price is expected to rise.
- Bearish. When the price rises, forming higher highs, but the relative strength index moves down with lower highs, this is a bearish divergence in the RSI; the price is expected to decline.
Hidden divergences:
- Bullish. When the price rises with higher lows, but the relative strength index declines with lower lows, traders expect the price to turn up.
- Bearish. When the price falls with lower highs, but the relative strength index moves upwards with higher highs, traders believe the price will decline.
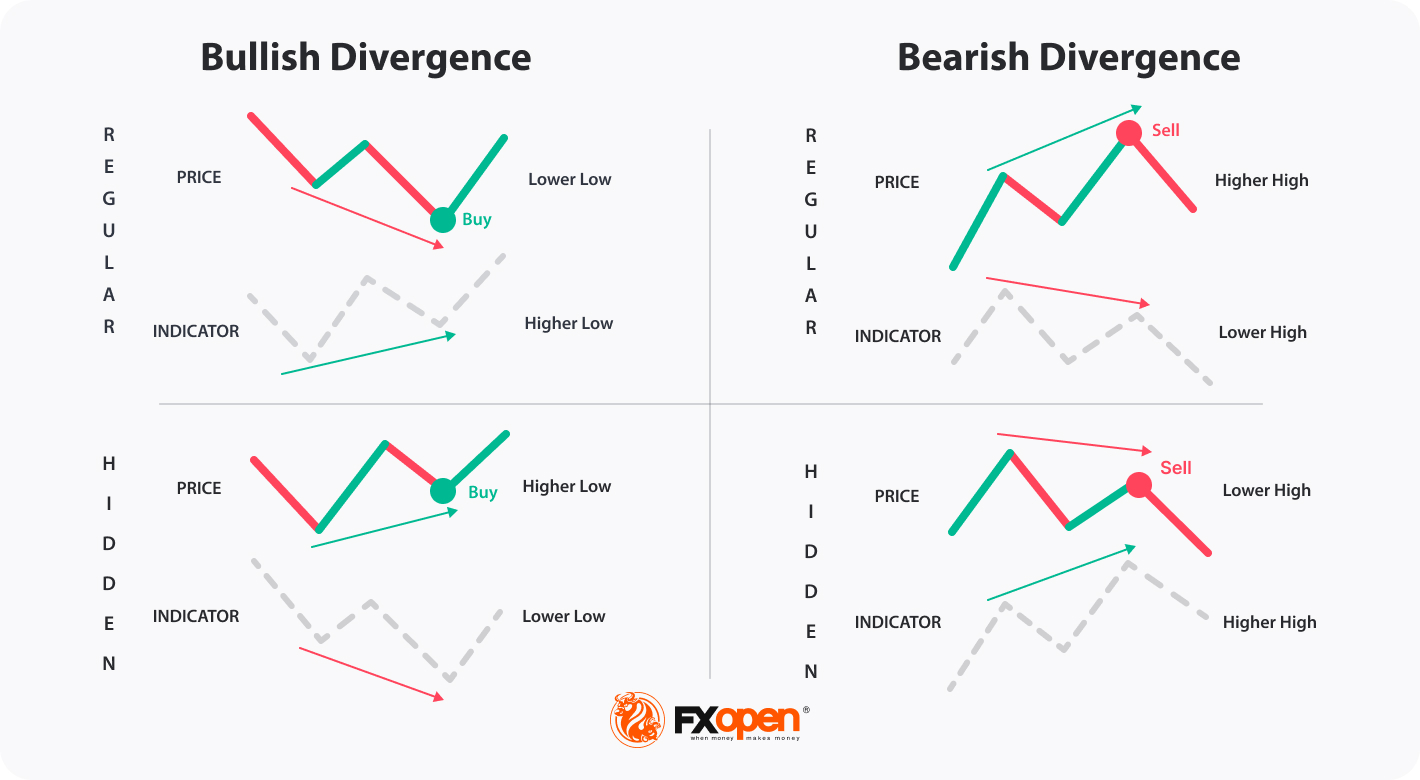
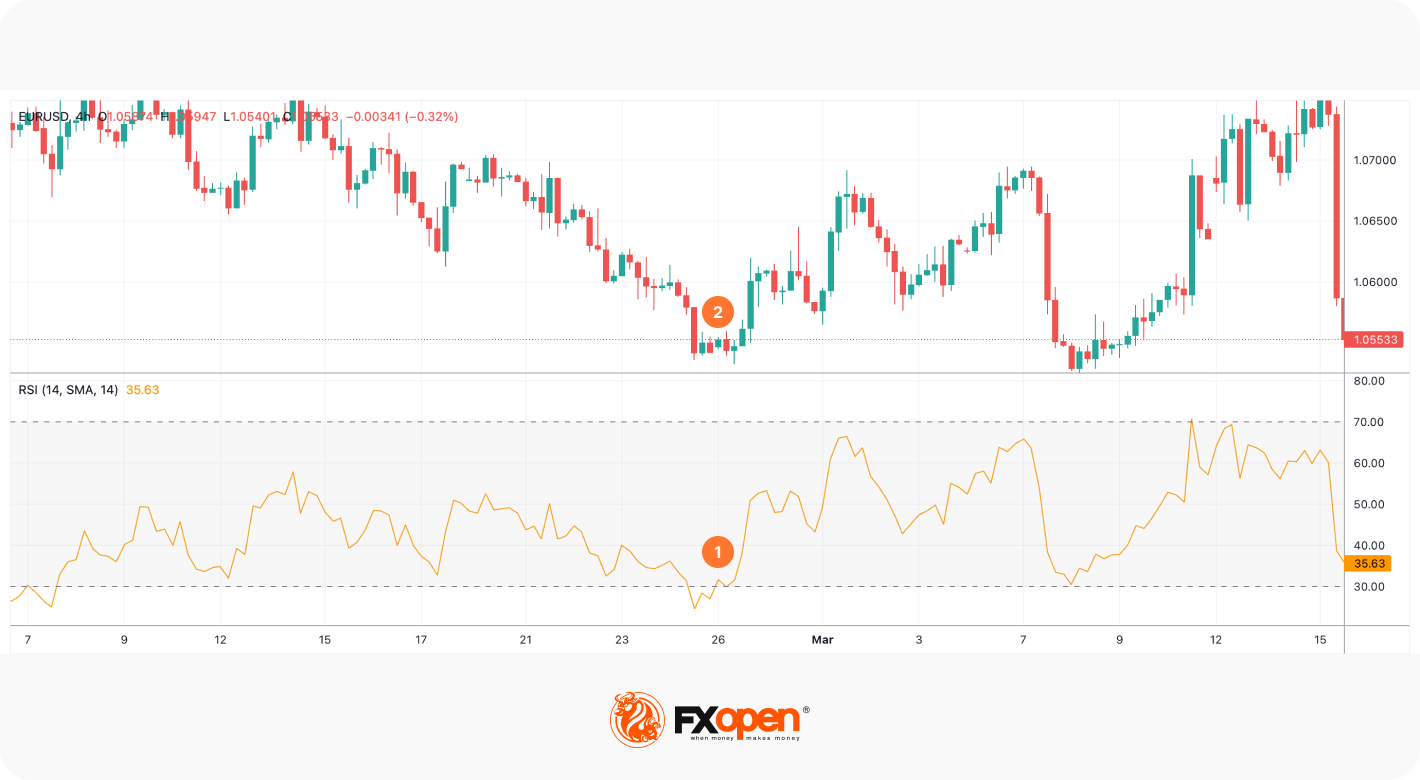
Regular and hidden RSI divergence
In the RSI example chart below, the indicator and the price formed a regular bearish divergence. As a result, the price fell (1). There was another divergence before the fall, but the price decline was short-lived (2). This highlights risks associated with the incorrect signals the RSI divergence may provide.
How to Avoid False RSI Divergence?
To limit false RSI divergence risks, traders can implement trend strength indicators such as the Average Directional Index or tools that show a trend change such as moving averages.

An example of the RSI divergence
RSI Failure Swings: A Lesser-Known Reversal Signal
Another signal that traders can consider is failure swings of the RSI which occur before a strong trend reversal. Although it is less common than the others, traders can add it to their list of tools.
The theory suggests traders don’t consider price actions but look at the indicator alone.
- Bullish reversal. A trend may turn bullish when the RSI breaks below 30, leaves the oversold area, falls to 30 but doesn’t cross it and rebounds, continuing to rise.
- Bearish reversal. A trend may reverse down when the RSI enters the overbought area, crosses below 70, and returns to 70 but bounces and continues falling.
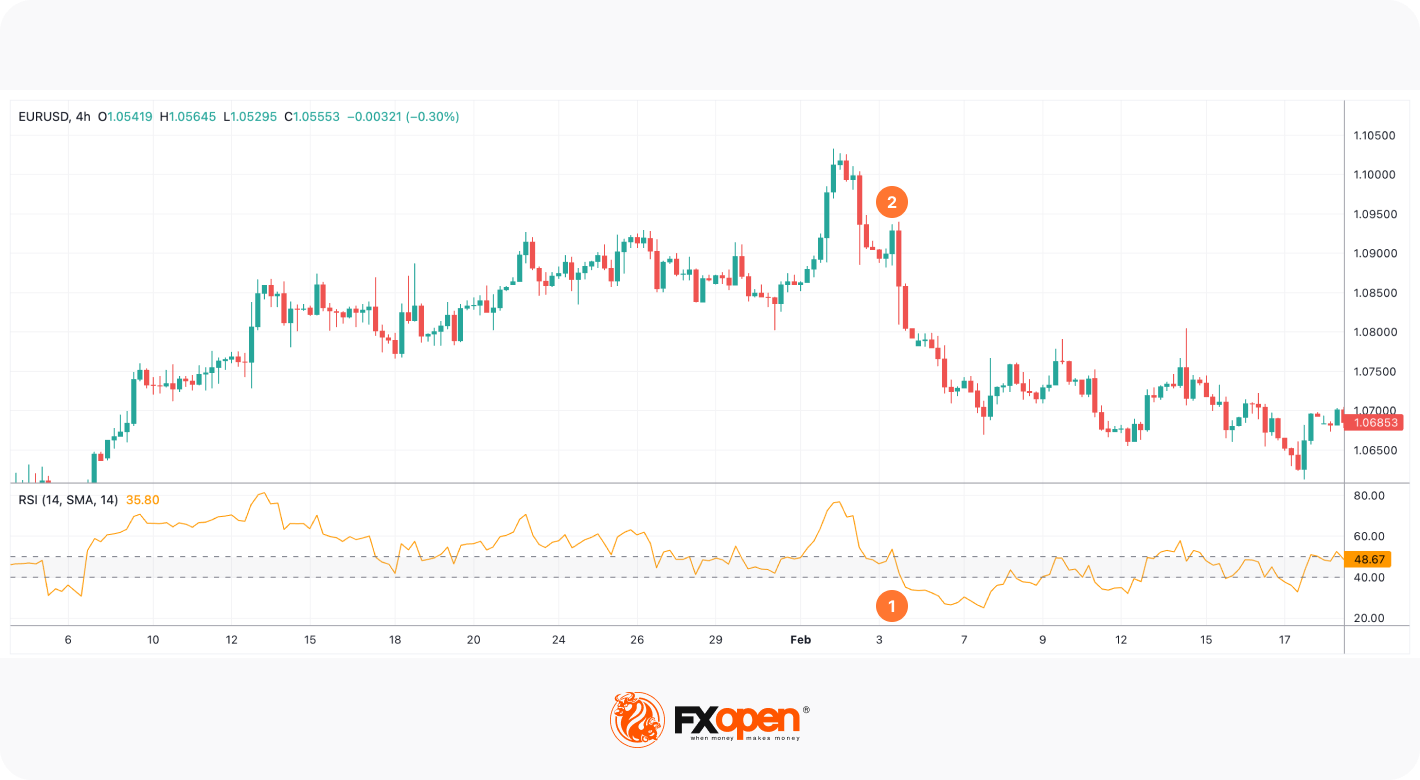
An example of RSI failure swings
In the chart above, the RSI trading indicator broke below 30, left the oversold area, and retested the 30 level (1). At the same time, the price formed the bottom, and the downtrend reversed upwards (2).
Failure swings are more common on short-term timeframes and do not always reflect a trend reversal. Therefore, traders combine the RSI with trend and volume indicators.
How Traders Identify Market Trends with RSI
The RSI can be used to identify a trend direction. Constance Brown, the author of multiple books about trading, noticed in her book Technical Analysis for the Trading Professional that the RSI indicator doesn’t fluctuate between 0 and 100. In a bullish trend, it moves in the 40-90 range. In a bearish trend, it fluctuates between 10 and 60.
To identify the trend, traders consider support and resistance levels. In an uptrend, the 40-50 zone serves as support. In a downtrend, the 50-60 range acts as resistance.
An example of trend determination using the RSI
In the chart above, the RSI stayed above 40 as the price was moving in a solid uptrend. Once it broke below the 40-50 support level (1), the trend changed (2).
However, there may be incorrect signals. In the chart below, the RSI broke below the support level twice, but the trend didn’t change.
An example of unsuccessful trend detection using RSI
Ranges may vary depending on the trend strength, price volatility, and the period of the RSI.
RSI and Simple Moving Average
Usually, the RSI indicator consists of a single line. However, there are variations of the indicator. It can be combined with the simple moving average. The moving average usually has the same period as the RSI.
The rule is that when the RSI breaks below the SMA, the price is supposed to fall (1). When the RSI rises above the SMA, the price is expected to increase (2).
RSI and Simple Moving Average
However, there are some aspects to consider. Firstly, traders avoid using RSI/SMA cross signals in the ranging market as the lines move close to each other and cross all the time, providing many fake signals. Secondly, a cross doesn’t determine the period of a rise or a fall. Traders use additional tools to identify where the price may turn around.
RSI Trading Strategies for All Markets
Let’s discuss two popular RSI trading strategies.
What Is the 70-30 RSI Trading Strategy?
70-30 RSI Trading Strategy
The 70-30 RSI strategy simply uses the overbought and oversold RSI readings to identify potential turning points. However, instead of simply going short above 70 (overbought) and long below 30 (oversold), traders typically apply a few levels of refinement.
Entry:
- Traders determine if the trend is bullish or bearish, usually using a moving average.
- They apply a trend filter. The RSI can produce false signals in a strong trend, showing overbought for a long time in a bullish trend and vice versa. They often use the 70-30 strategy to look for shorts when the price rallies in a downtrend and longs when the price dips in an uptrend.
- They enter the market when the RSI crosses back into the normal range. For instance, they’ll open a short trade when the RSI falls back below 70, indicating that a potential bearish reversal may be underway.
Stop Loss:
- Stop losses are often set beyond a nearby swing point.
Take Profit:
- Profits might be taken at an area of support or resistance when the RSI hits the opposite extreme (e.g. 70 when long), or when other indicators signal a price reversal.
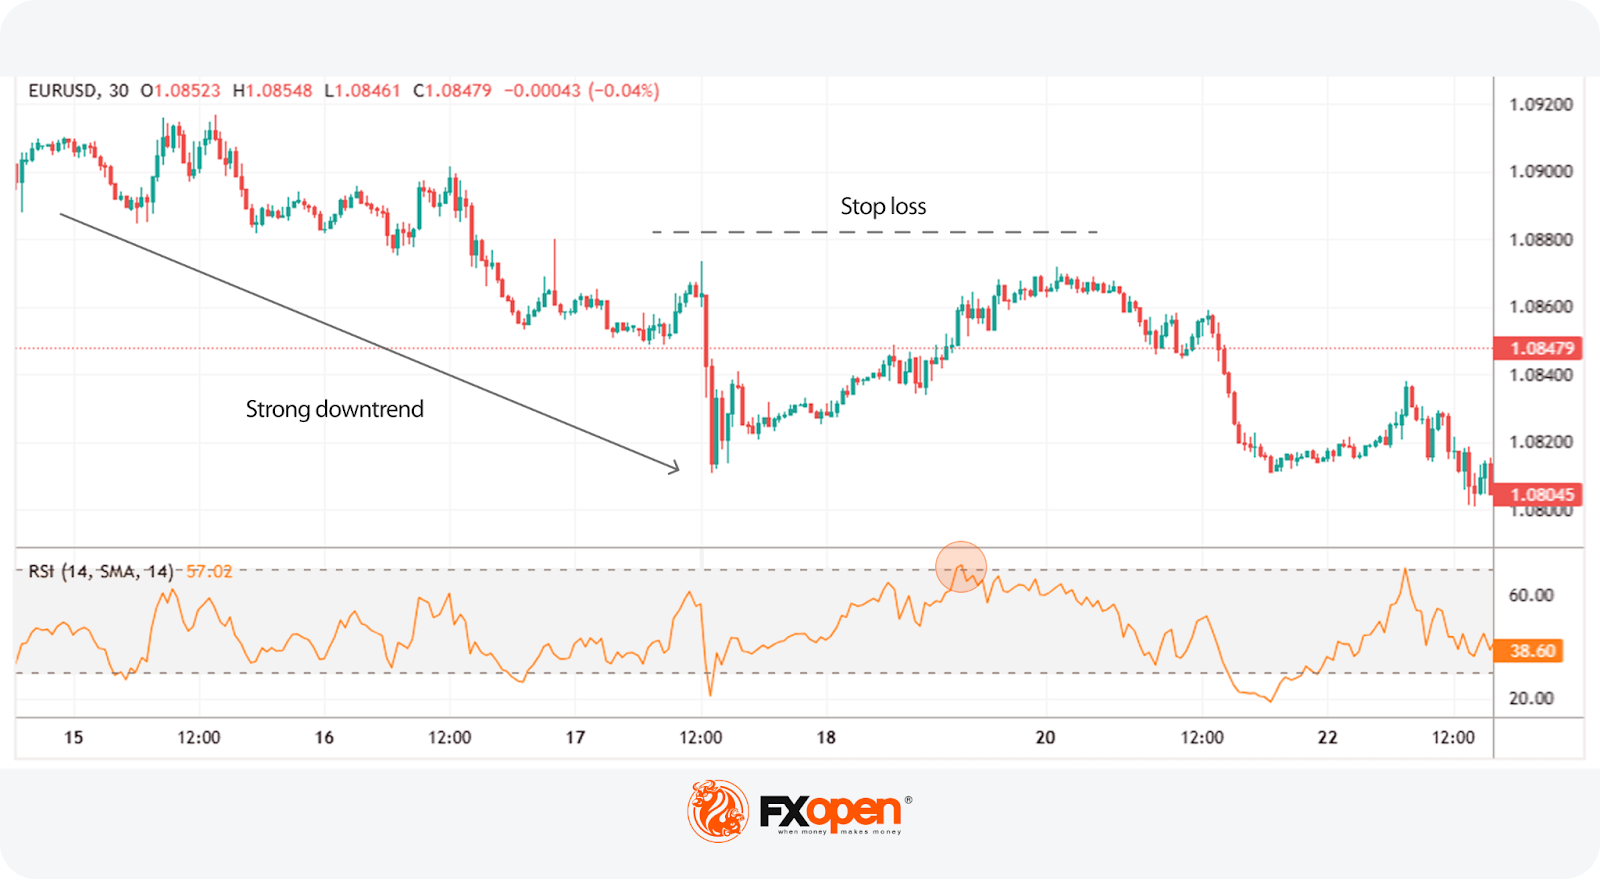
What Is the 50-60 RSI Trading Strategy?
50-60 RSI Trading Strategy
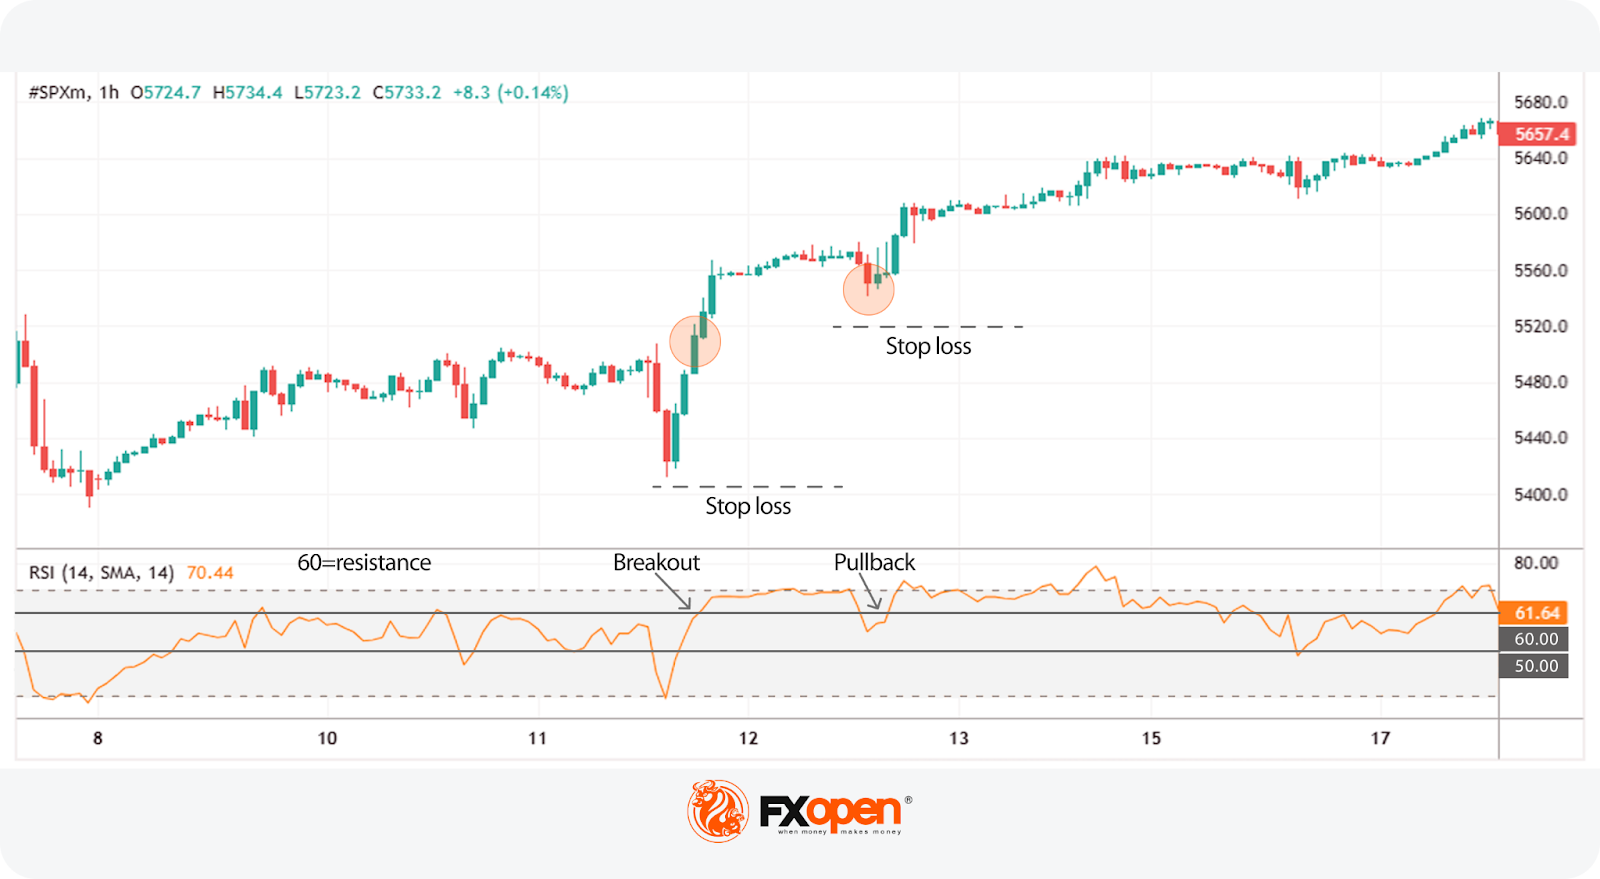
The 50-60 RSI strategy works on the idea that the market shows bullish momentum above 50, with 60 acting as a resistance level. When the price breaks through 60, it can signal that bullishness is strong, offering a potential entry point.
Note:
- Despite the name, the same logic can be applied in a bearish trend, where 40 acts as a support level.
- This strategy is popular in markets with a strong trend. Indices, such as the S&P 500 and Nasdaq 100, or commodities like gold, that exhibit strong trends are often chosen by traders.
Entry:
- Traders may enter the market when the price crosses above 60 for the first time.
- Alternatively, they might wait for a pullback to 60 before going long.
Stop Loss:
- A stop loss may be set beyond the nearest major swing point or just beyond the entry candle on a pullback.
- Alternatively, some traders manually stop out if the price crosses below 50.
Take Profit:
- Profits might be taken when the price crosses below 50, giving room for the trade to run in a strong trend. However, this may limit potential returns when trading on short-term timeframes. Therefore, some traders prefer the closest resistance levels.
Opposite rules are applied to the strategy with 40 and 50 levels.
How to Use the Relative Strength Index with Other Indicators
Traders can develop their own strategies and decide what combinations of indicators work for them. However, there are some standard recommendations you may want to refer to.
RSI with MACD
RSI and MACD (moving average convergence divergence) are oscillators. However, they measure momentum differently, which allows one to confirm the signals of another. Usually, traders look for RSI overbought/oversold signals and MACD divergence. For instance, when the RSI is in the oversold zone but the MACD has a bullish divergence with the price chart, traders consider this a confirmation of a coming price rise. Read our article RSI vs. MACD.
RSI with Moving Averages
Early signals are one of the limitations of the RSI indicator. Therefore, traders often combine them with lagging technical analysis tools. An exponential moving average (EMA) is one of the options. Traders add two EMAs with different periods to the chart and wait for a cross to confirm the trend reversal signal the RSI provided.
RSI with Bollinger Bands
Bollinger bands are used similarly to the RSI, showing when the market is possibly overbought or oversold. Used together, these two indicators can provide confluence; for example, if the RSI indicates overbought and the price has closed through the upper band, then there may be an increased likelihood of a bearish reversal, and vice versa.
RSI with On-Balance Volume (OBV)
The on-balance volume (OBV) is a tool that tracks volume to confirm trends. Paired with the RSI, it has two uses. The first is that it can indicate trend strength. If the RSI is falling alongside the OBV, the bearish trend is likely genuine and vice versa. The second is confirming divergences. The OBV can diverge from the price like the RSI, so if both diverge, a reversal may be inbound.
Pros and Cons of the RSI Indicator
Although the relative strength index is one of the most popular indicators, it has limitations. Let’s explore the two sides of the coin.
Benefits of the RSI in Trading
The relative strength index is a useful tool because of:
- Numerous signals. The RSI provides different signals so traders with different trading approaches can add it to their tool list.
- Numerous assets and timeframes. One of its advantages is that you can use the RSI on any timeframe of any asset. What does the RSI stand for in stocks? The same thing that it stands for in forex, commodity, and cryptocurrency* markets.
- Simplicity. Despite the wide range of signals, it’s easy to remember them. If you are familiar with other oscillators such as the Stochastic oscillator, you will quickly learn how to use the RSI indicator.
- Standard settings. Although you can change the period of the RSI, its standard period of 14 is used in many trading strategies.
- Working signals. The RSI is one of the most popular trading tools. However, the reliability of its signals depends on trader skills and market conditions.
Limitations and False Signals of RSI
Although the RSI is a functional tool, there are some pitfalls traders should consider.
- Weak at trend reversals. The indicator may provide early signals when spotting trend reversal.
- False signals. The relative strength index isn’t a very popular tool in ranging markets.
- Lagging indicator. The RSI is based on past price data, meaning it may be relatively slow to react to sudden movements.
- Overbought/oversold conditions can persist. In strong trends, prices may remain above 70 or below 30 for long periods, leading to premature entries and exits.
Final Thoughts
The relative strength index is a popular technical analysis tool. It is used by traders with all experience levels and trading approaches. The RSI provides many trading signals and can be combined with many other technical analysis tools.
Open an FXOpen account today to build your own trading strategy and trade with tight spreads and low commissions!
FAQ
What Does the RSI Stand For?
RSI stands for relative strength index. It’s a momentum-based indicator that measures the speed and magnitude of price movements.
How Traders Use the RSI Indicator
The RSI moves between 0 and 100, with >70 meaning the asset is overbought and <30 meaning oversold. It can be used to spot potential market reversals and confirm trend strength.
What Is the RSI in Stocks?
The RSI meaning in stocks refers to the same RSI indicator used in other asset classes. It’s used to gauge buying and selling pressure.
Is High RSI Bullish or Bearish?
A high RSI (above 70) signals bullish momentum, suggesting an overbought market and a soon downward reversal.
*Important: At FXOpen UK, Cryptocurrency trading via CFDs is only available to our Professional clients. They are not available for trading by Retail clients. To find out more information about how this may affect you, please get in touch with our team.