Bitcoin Price Forms a Potentially Strong Bullish Pattern

Positive sentiment in the cryptocurrency market is currently being driven by:
→ The approval of a bill regulating the status of stablecoins;
→ Easing geopolitical tensions (a ceasefire in the Middle East and a trade agreement between China and the US);
→ Weakening US dollar, which increases the attractiveness of assets priced in USD.
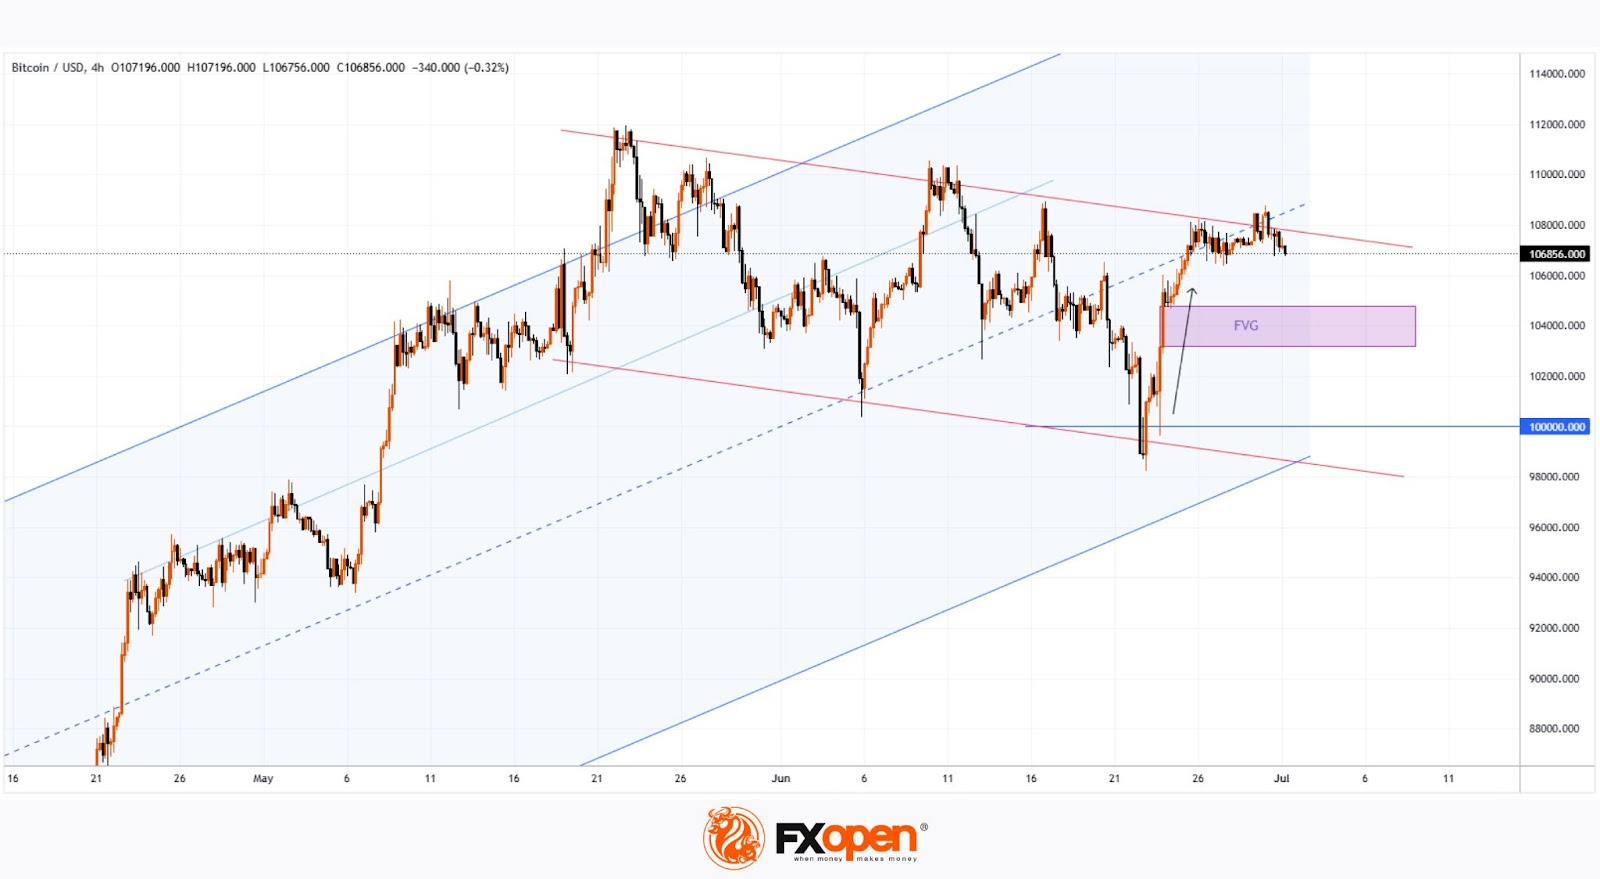
These and other developments have contributed to a strong bullish impulse (indicated by the arrow) on the BTC/USD chart. According to media reports, $2.2 billion was invested in Bitcoin over the past week, signalling an acceleration in capital inflows. Since the beginning of 2025, nearly $17 billion has been invested. So, how might things unfold from here?
Technical Analysis of the BTC/USD Chart
The chart shows that Bitcoin price movements have formed an ascending channel (highlighted in blue), with a strong rebound from the psychological $100k level (whose significance we discussed on 23 June) underscoring robust demand and casting doubt on the idea that Bitcoin might ever stabilise in the five-digit range again.
From a technical perspective, the setup resembles a Bull Flag pattern, forming (as marked by the red lines) within a long-term uptrend. This is a potentially powerful scenario, in which a breakout above the upper boundary of the pattern could lead to a continuation of the broader rally.
In the short term, bulls might encounter resistance along the red trendline; however, note the aggressive surge marked by the arrow. In Smart Money Concept terms, this could be interpreted as a Fair Value Gap pattern—indicating strong buyer dominance. It’s also worth noting that the broad area shaded in purple might act as a support zone for bulls attempting to break through the corrective structure.