Market Analysis: Gold Drop, Oil Slides — Traders Eye Macro Triggers

Gold price started a fresh decline below $3,320. WTI Crude oil is down over 15% and remains at risk of more losses.
Important Takeaways for Gold and WTI Crude Oil Price Analysis Today
- Gold price climbed higher toward the $3,400 zone before there was a sharp decline against the US Dollar.
- A key bearish trend line is forming with resistance near $3,300 on the hourly chart of gold at FXOpen.
- WTI Crude oil extended losses below the $68.00 support zone.
- A major bearish trend line is forming with resistance near $65.60 on the hourly chart of XTI/USD at FXOpen.
Technical Analysis of Gold Price
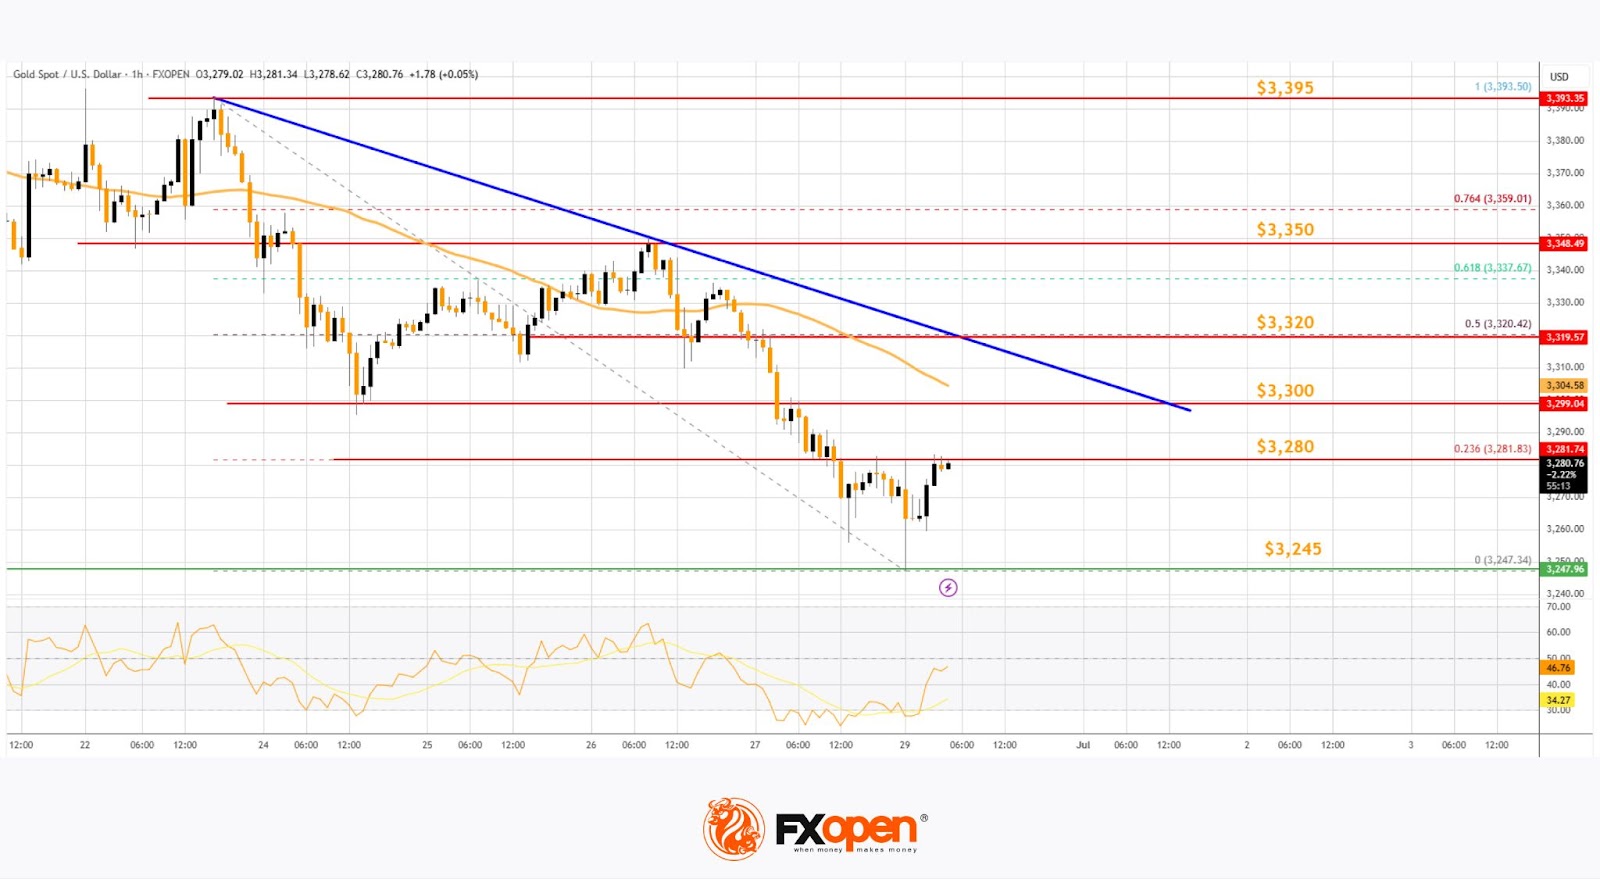
On the hourly chart of Gold at FXOpen, the price climbed above the $3,320 resistance. The price even spiked above $3,350 before the bears appeared.
A high was formed near $3,395 before there was a fresh decline. There was a move below the $3,350 support level. The bears even pushed the price below the $3,300 support and the 50-hour simple moving average.
It tested the $3,245 zone. A low is formed near $3,247 and the price is now showing bearish signs. There was a minor recovery wave toward the 23.6% Fib retracement level of the downward move from the $3,393 swing high to the $3,247 low.
However, the bears are active below $3,300. Immediate resistance is near $3,280. The next major resistance is near the $3,300 zone. There is also a key bearish trend line forming with resistance near $3,300.
The main resistance could be $3,320 or the 50% Fib retracement level, above which the price could test the $3,350 resistance. The next major resistance is $3,395.
An upside break above the $3,395 resistance could send Gold price toward $3,420. Any more gains may perhaps set the pace for an increase toward the $3,450 level.
Initial support on the downside is near the $3,245 level. The first major support is near the $3,220 level. If there is a downside break below the $3,220 support, the price might decline further. In the stated case, the price might drop toward the $3,200 support.
Technical Analysis of WTI Crude Oil Price
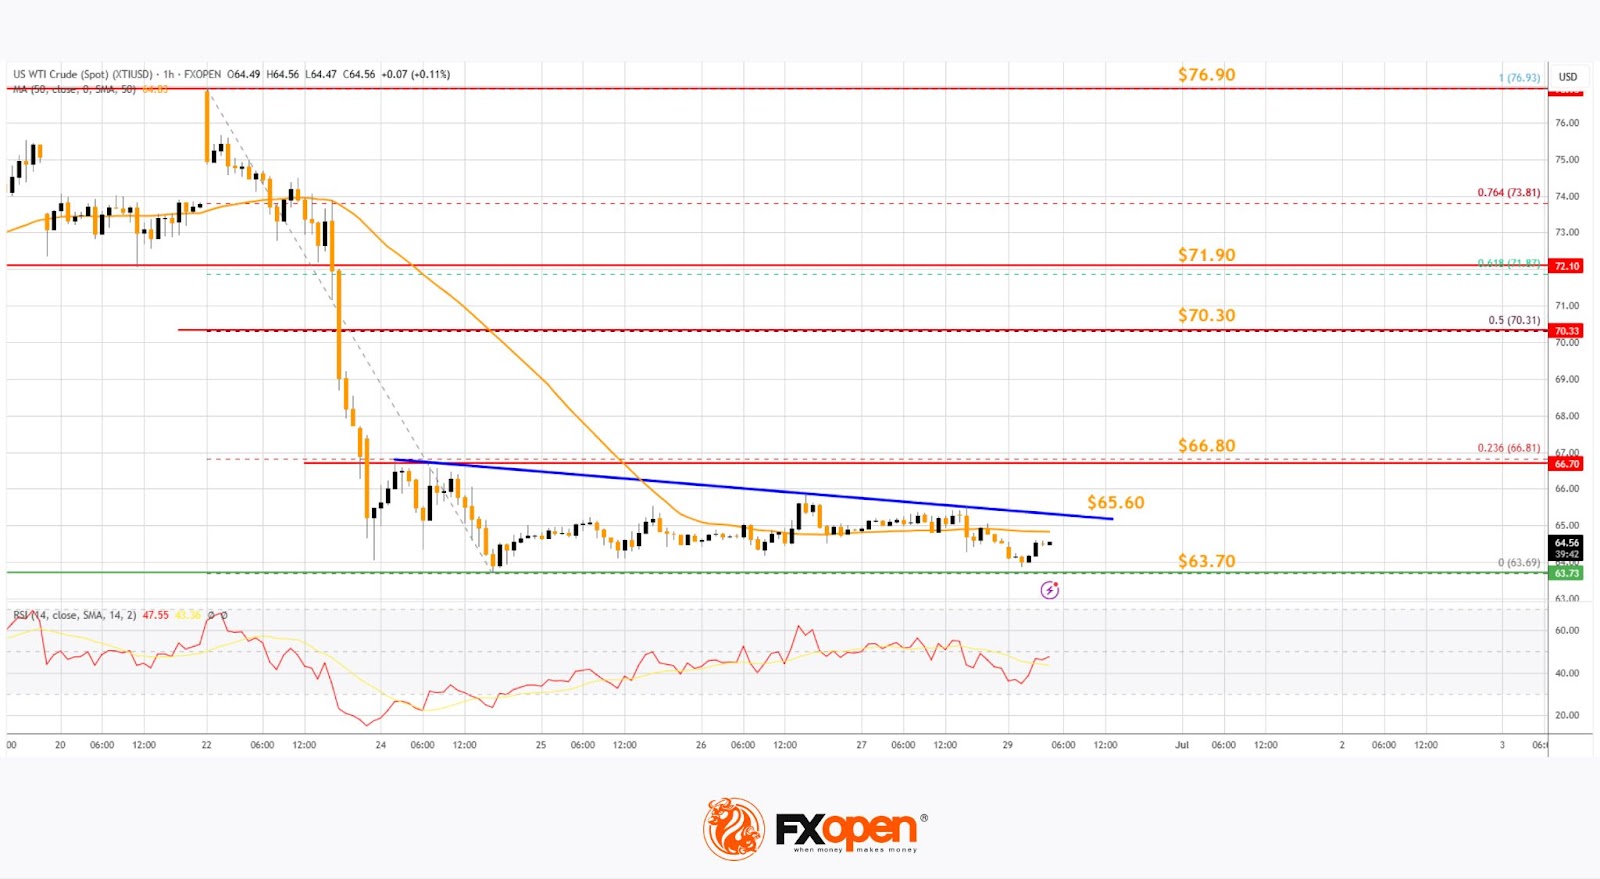
On the hourly chart of WTI Crude Oil at FXOpen, the price struggled to continue higher above $77.00 against the US Dollar. The price formed a short-term top and started a fresh decline below $72.00.
There was a steady decline below the $70.00 pivot level. The bears even pushed the price below $68.00 and the 50-hour simple moving average. Finally, the price tested the $63.70 zone. The recent swing low was formed near $63.69, and the price is now consolidating losses.
On the upside, immediate resistance is near the $65.60 zone. There is also a major bearish trend line forming with resistance near $65.60. The next resistance is near the $66.80 level or the 23.6% Fib retracement level of the downward move from the $76.93 swing high to the $63.69 low.
The main resistance is $70.30 and the 50% Fib retracement level. A clear move above the $70.30 zone could send the price toward $71.90.
The next key resistance is near $76.90. If the price climbs further higher, it could face resistance near $78.00. Any more gains might send the price toward the $80.00 level.
Immediate support is near the $63.70 level. The next major support on the WTI Crude Oil chart is near $62.00. If there is a downside break, the price might decline toward $60.00. Any more losses may perhaps open the doors for a move toward the $55.00 support zone.