Bearish Technical Signals Emerge: Bitcoin Forms ‘Death Cross’ Amid Descending Triangle Pattern
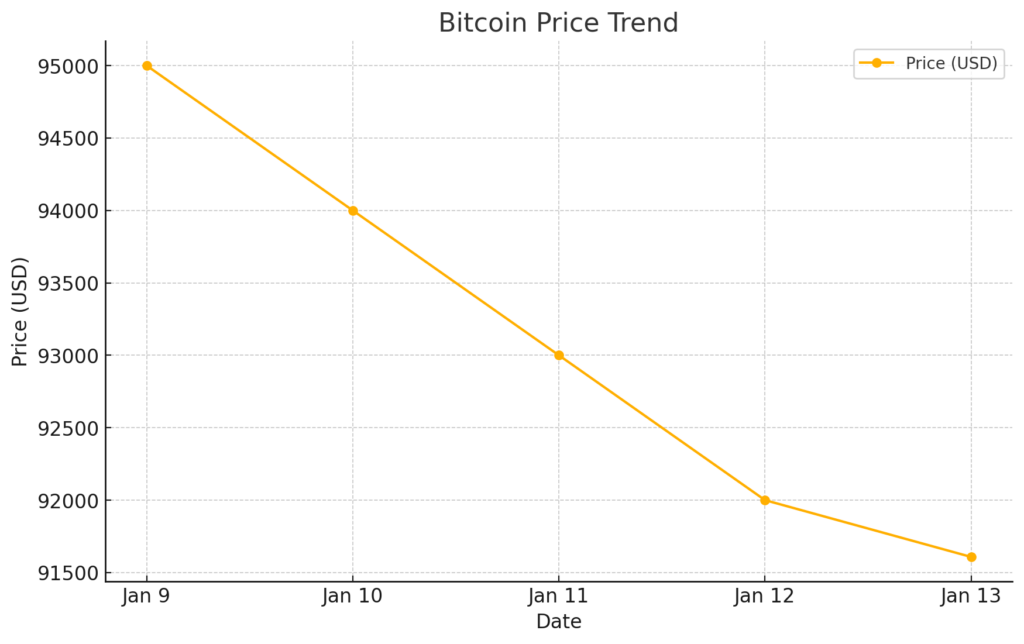
Bitcoin (BTC), the world’s leading cryptocurrency, is trading at approximately $91,608 as of January 13, 2025. This marks a 2.59% decrease from the previous close. Intraday price movement has seen Bitcoin fluctuate between a high of $96,022 and a low of $91,283, reflecting the asset’s inherent volatility. Over the past week, Bitcoin has experienced a cumulative decline of 3.99%, signaling a bearish short-term trend.
Daily trading volume for Bitcoin stands at $18.82 billion, indicating consistent market participation. These figures underscore sustained interest in the cryptocurrency despite recent downward price pressure.
Price Dynamics and Market Depth
Market depth analysis reveals a higher concentration of sell orders, suggesting the presence of significant resistance levels around $95,000. Support for the cryptocurrency is currently observed at $90,000, with the price expected to remain within this trading range in the near term.
Volatility remains moderate, with Bitcoin’s 30-day volatility index recorded at 4.5%. This level of fluctuation is typical for the asset, though it remains a point of consideration for traders and investors managing exposure.
On-Chain Activity and Network Health
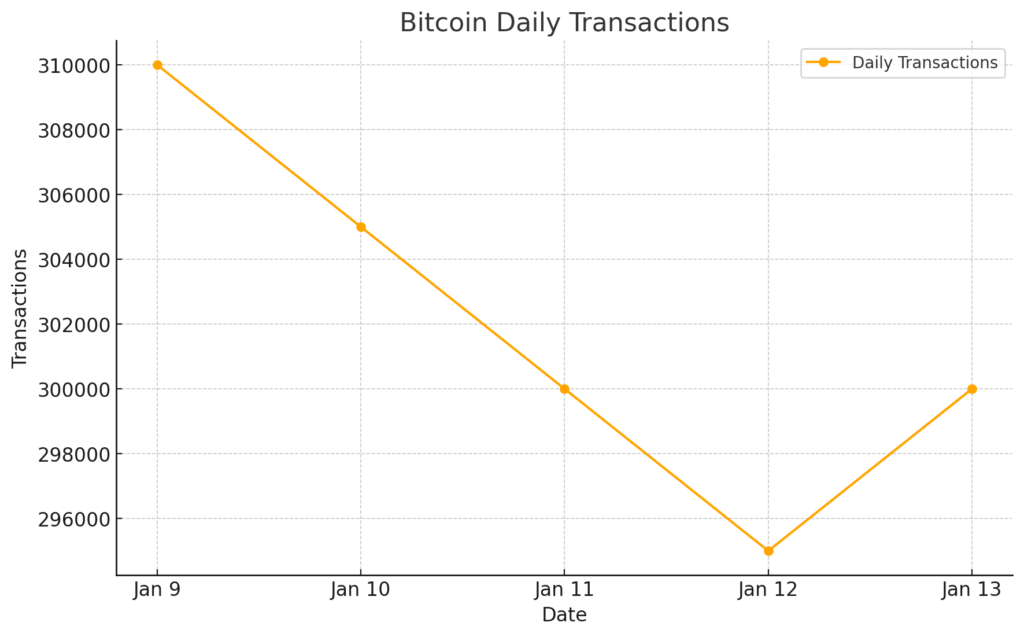
Bitcoin’s network activity continues to exhibit robust performance. Over 1 million active addresses were recorded, highlighting widespread usage of the blockchain. The network processes approximately 300,000 transactions daily, maintaining a steady flow of activity that underscores its role as a primary transactional platform in the crypto space.
Large transactions, commonly associated with institutional or “whale” activity, have increased recently, with several movements exceeding 1,000 BTC. These high-value transactions suggest active portfolio rebalancing or strategic positioning by major holders.The Bitcoin network’s hash rate, a key indicator of mining activity and security, is at an impressive 715.49 exahashes per second (EH/s).
Technical Indicators Point to Caution
Technical analysis paints a cautious picture for Bitcoin. The Relative Strength Index (RSI) currently stands at 45, indicating a neutral position without overbought or oversold conditions. However, the Moving Average Convergence Divergence (MACD) indicator shows bearish momentum, with the MACD line crossing below the signal line.
Additionally, the 50-day Exponential Moving Average (EMA) has fallen below the 200-day Simple Moving Average (SMA), forming a “death cross.” This technical signal often heralds extended bearish conditions. A descending triangle pattern observed on the charts further supports the possibility of continued downward pressure in the market.
Macro and Regulatory Environment
In the broader economic context, regulatory clarity has been improving. Recent guidelines issued by financial authorities in the U.S. and Europe aim to streamline compliance and reduce uncertainties for cryptocurrency investors. These developments could foster a more stable investment environment over the long term.
Bitcoin’s performance has also been influenced by macroeconomic factors, including the Federal Reserve’s decision to maintain current interest rates. Additionally, the U.S. Dollar Index (DXY) has strengthened to 95, which typically inversely affects Bitcoin’s price. As a result, Bitcoin has faced headwinds in its role as an alternative asset.
Derivatives Market and Institutional Activity
Open interest in Bitcoin futures has surged to $10 billion, reflecting heightened activity in the derivatives market. The number of open contracts has increased by 20% over the past month, indicating growing speculative interest. Funding rates on perpetual futures contracts have turned negative, suggesting that short positions are paying longs—a bearish signal.
The sustained activity in the derivatives market suggests that traders are closely monitoring Bitcoin’s price trajectory, using both long and short positions to capitalize on its price movements.